

Question: The days when something happens and it is not captured on camera appear to be over The bar graph shows that by 2007 68 of
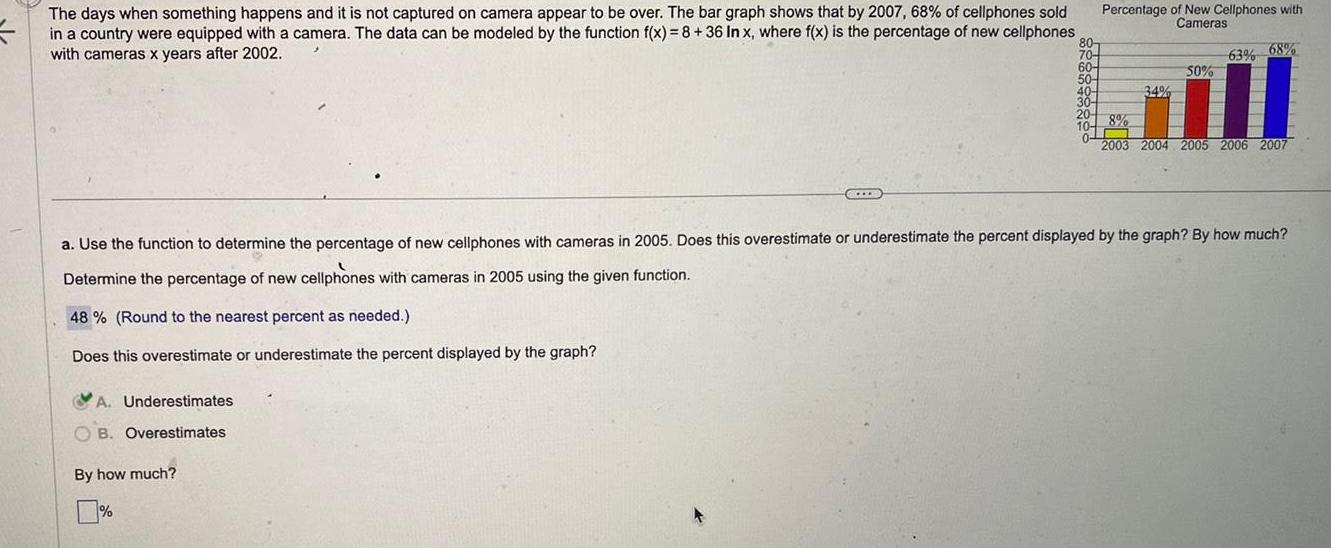

The days when something happens and it is not captured on camera appear to be over The bar graph shows that by 2007 68 of cellphones sold in a country were equipped with a camera The data can be modeled by the function f x 8 36 In x where f x is the percentage of new cellphones with cameras x years after 2002 A Underestimates B Overestimates GILB By how much 80 70 60 50 40 Percentage of New Cellphones with Cameras 50 34 63 68 II 8 2003 2004 2005 2006 2007 a Use the function to determine the percentage of new cellphones with cameras in 2005 Does this overestimate or underestimate the percent displayed by the graph By how much Determine the percentage of new cellphones with cameras in 2005 using the given function 48 Round to the nearest percent as needed Does this overestimate or underestimate the percent displayed by the graph
Step by Step Solution
There are 3 Steps involved in it

Get step-by-step solutions from verified subject matter experts