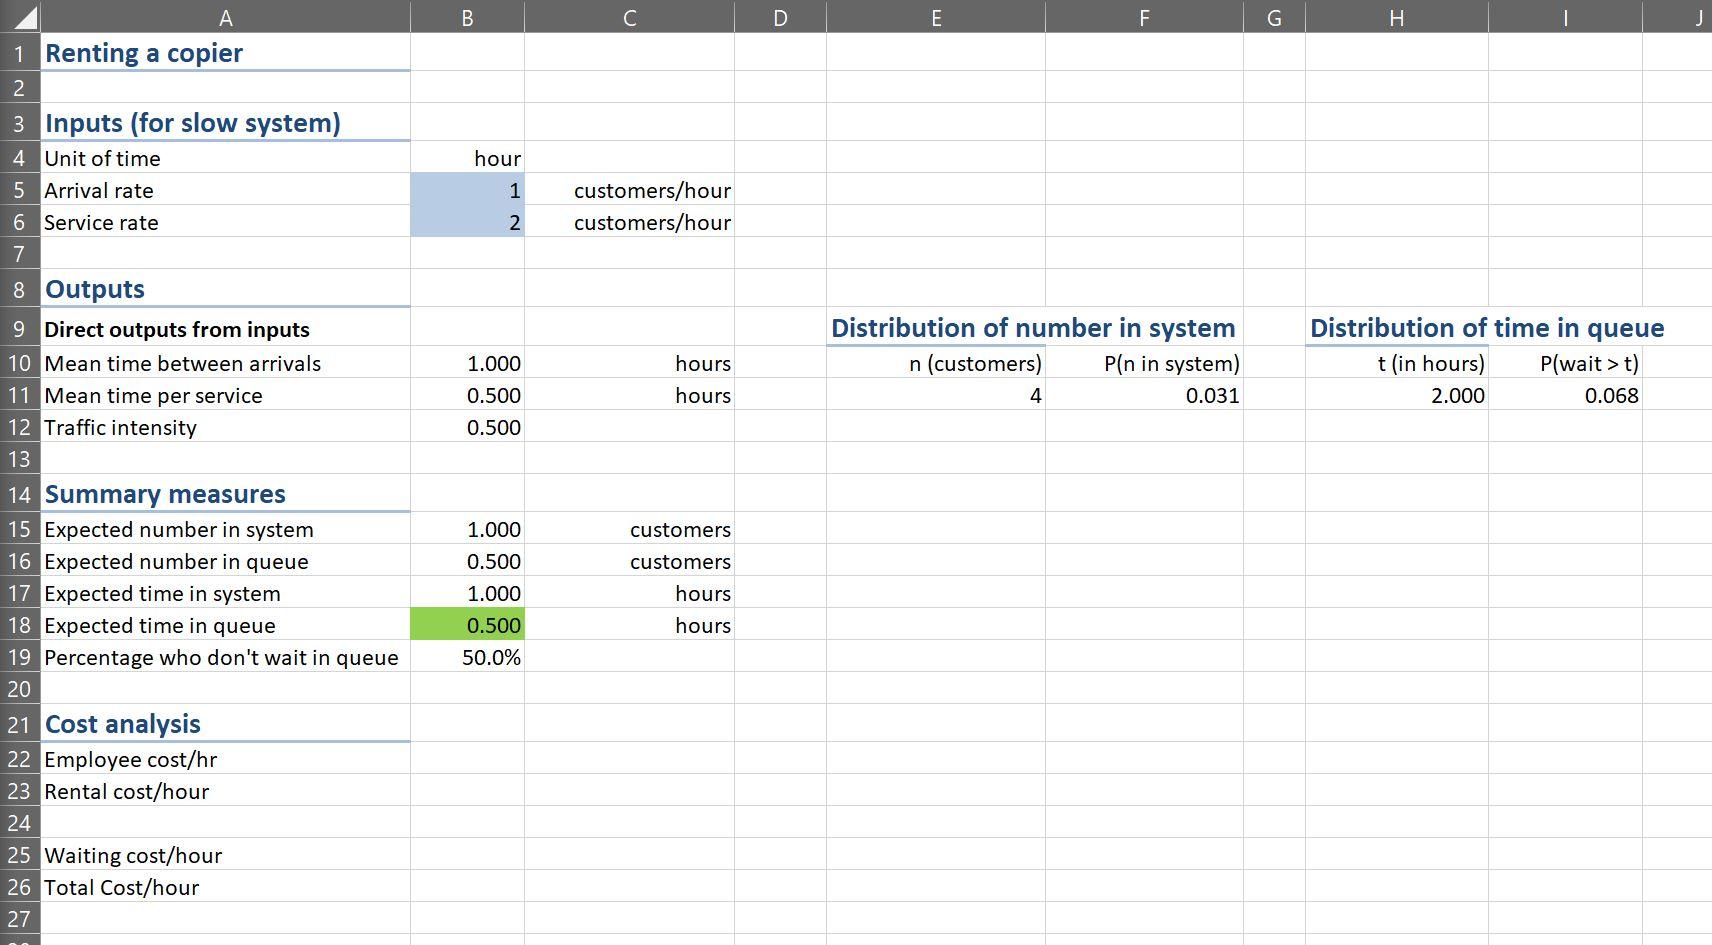
Question: The Decision Sciences Department is trying to determine whether to rent a slow or a fast copier. The department believes that an employee's time is

The Decision Sciences Department is trying to determine whether to rent a slow or a fast copier. The department believes that an employee's time is worth $15 per hour. The slow copier rents for $4 per hour, and it takes an employee an average of 10 minutes to complete copying. On average, four employees per hour need to use the copying machine. (Assume the copying times and interarrival times to the copying machine are exponentially distributed.) Which copy machine should the department rent to minimize expected total cost per hour? Given the data below:

The Decision Sciences Department is trying to

B C D E F G H hour 1 customers/hour customers/hour 2 1.000 0.500 0.500 hours hours Distribution of number in system n (customers) Pln in system) 0.031 Distribution of time in queue tin hours) P(wait > t) 2.000 0.068 4 1 Renting a copier 2 3 Inputs (for slow system) 4 Unit of time 5 Arrival rate 6 Service rate 7 8 Outputs 9 Direct outputs from inputs 10 Mean time between arrivals 11 Mean time per service 12 Traffic intensity 13 14 Summary measures 15 Expected number in system 16 Expected number in queue 17 Expected time in system 18 Expected time in queue 19 Percentage who don't wait in queue 20 21 Cost analysis 22 Employee cost/hr 23 Rental cost/hour 24 25 Waiting cost/hour 26 Total Cost/hour 27 customers 1.000 0.500 1.000 0.500 50.0% customers hours hours B C D E F G H hour 1 customers/hour customers/hour 2 1.000 0.500 0.500 hours hours Distribution of number in system n (customers) Pln in system) 0.031 Distribution of time in queue tin hours) P(wait > t) 2.000 0.068 4 1 Renting a copier 2 3 Inputs (for slow system) 4 Unit of time 5 Arrival rate 6 Service rate 7 8 Outputs 9 Direct outputs from inputs 10 Mean time between arrivals 11 Mean time per service 12 Traffic intensity 13 14 Summary measures 15 Expected number in system 16 Expected number in queue 17 Expected time in system 18 Expected time in queue 19 Percentage who don't wait in queue 20 21 Cost analysis 22 Employee cost/hr 23 Rental cost/hour 24 25 Waiting cost/hour 26 Total Cost/hour 27 customers 1.000 0.500 1.000 0.500 50.0% customers hours hours

Step by Step Solution

There are 3 Steps involved in it

1 Expert Approved Answer
Step: 1 Unlock blur-text-image
Question Has Been Solved by an Expert!

Get step-by-step solutions from verified subject matter experts

Step: 2 Unlock
Step: 3 Unlock

Students Have Also Explored These Related General Management Questions!