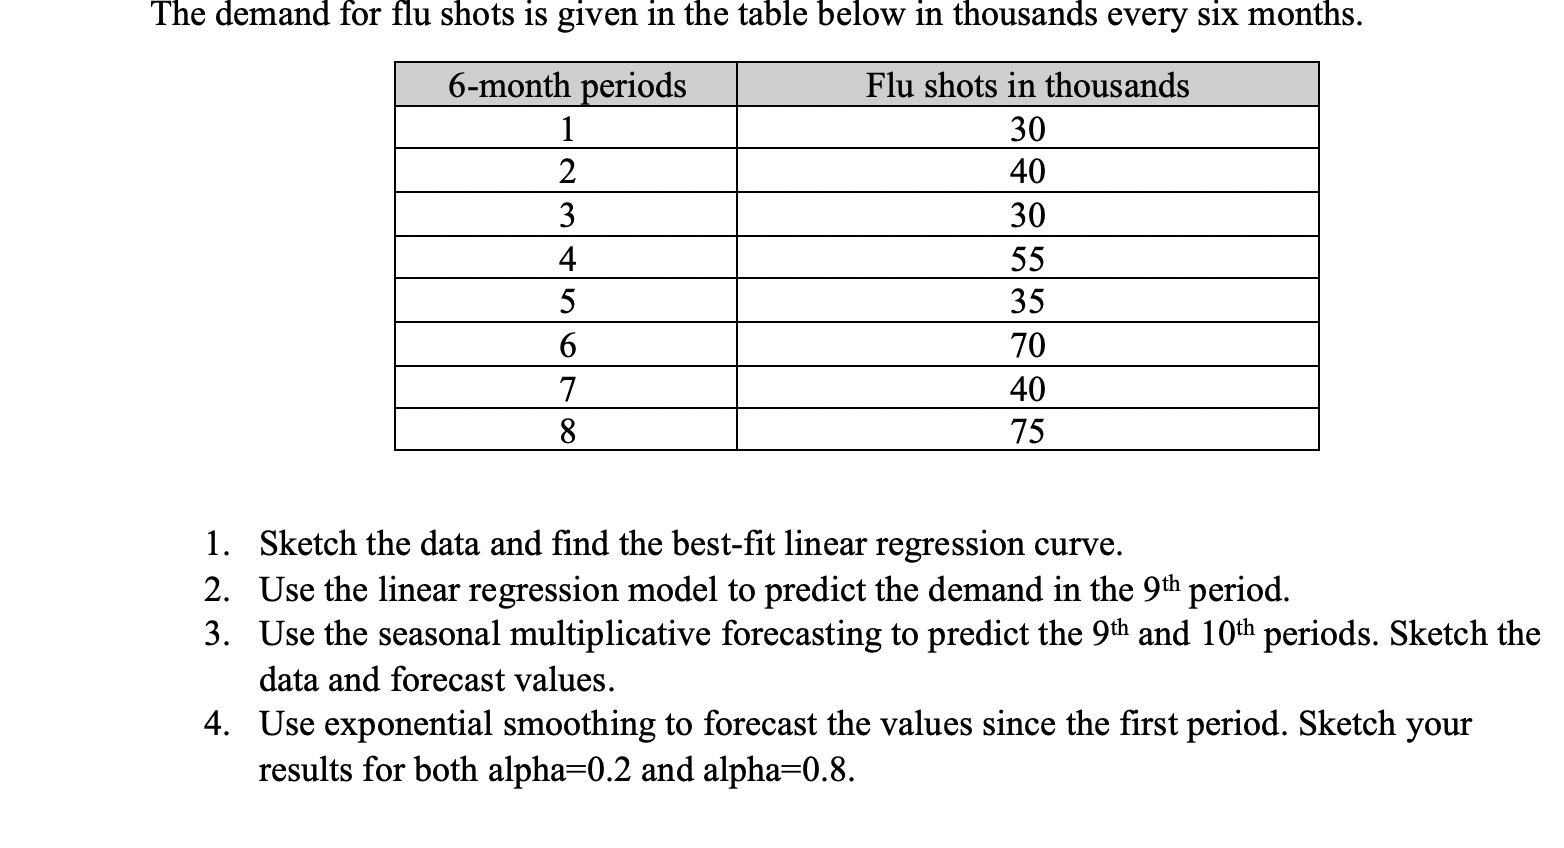
Question: The demand for flu shots is given in the table below in thousands every six months. 6-month periods 1 2 3 4 5 6 7

The demand for flu shots is given in the table

The demand for flu shots is given in the table below in thousands every six months. 6-month periods 1 2 3 4 5 6 7 8 Flu shots in thousands 30 40 30 55 35 70 40 75 1. Sketch the data and find the best-fit linear regression curve. 2. Use the linear regression model to predict the demand in the 9th period. 3. Use the seasonal multiplicative forecasting to predict the 9th and 10th periods. Sketch the data and forecast values. 4. Use exponential smoothing to forecast the values since the first period. Sketch your results for both alpha=0.2 and alpha=0.8

Step by Step Solution

There are 3 Steps involved in it

1 Expert Approved Answer
Step: 1 Unlock blur-text-image
Question Has Been Solved by an Expert!

Get step-by-step solutions from verified subject matter experts

Step: 2 Unlock
Step: 3 Unlock

Students Have Also Explored These Related General Management Questions!