

Question: The diagram below depicts an auditor's computed upper exception rate (CUER) compared with the tolerable exception rate (TER), and also depicts the true population exception
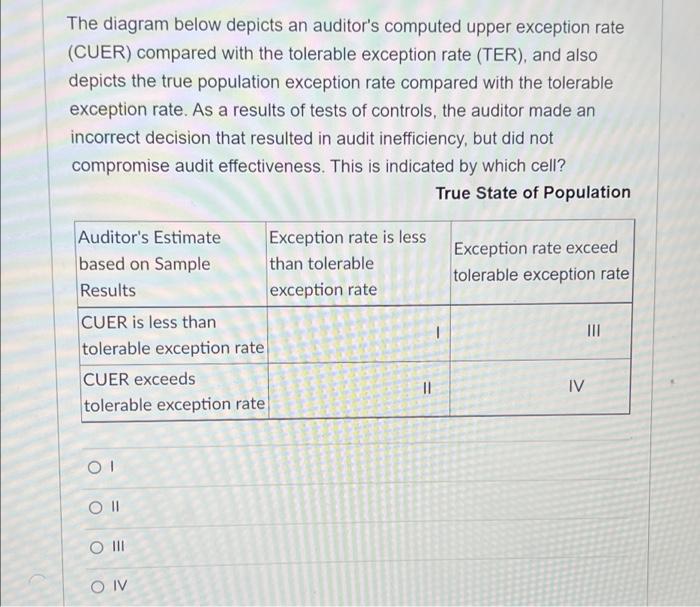
The diagram below depicts an auditor's computed upper exception rate (CUER) compared with the tolerable exception rate (TER), and also depicts the true population exception rate compared with the tolerable exception rate. As a results of tests of controls, the auditor made an incorrect decision that resulted in audit inefficiency, but did not compromise audit effectiveness. This is indicated by which cell? True State of Population Exception rate exceed tolerable exception rate Auditor's Estimate Exception rate is less based on Sample than tolerable Results exception rate CUER is less than tolerable exception rate CUER exceeds II tolerable exception rate III
Step by Step Solution
There are 3 Steps involved in it

Get step-by-step solutions from verified subject matter experts