

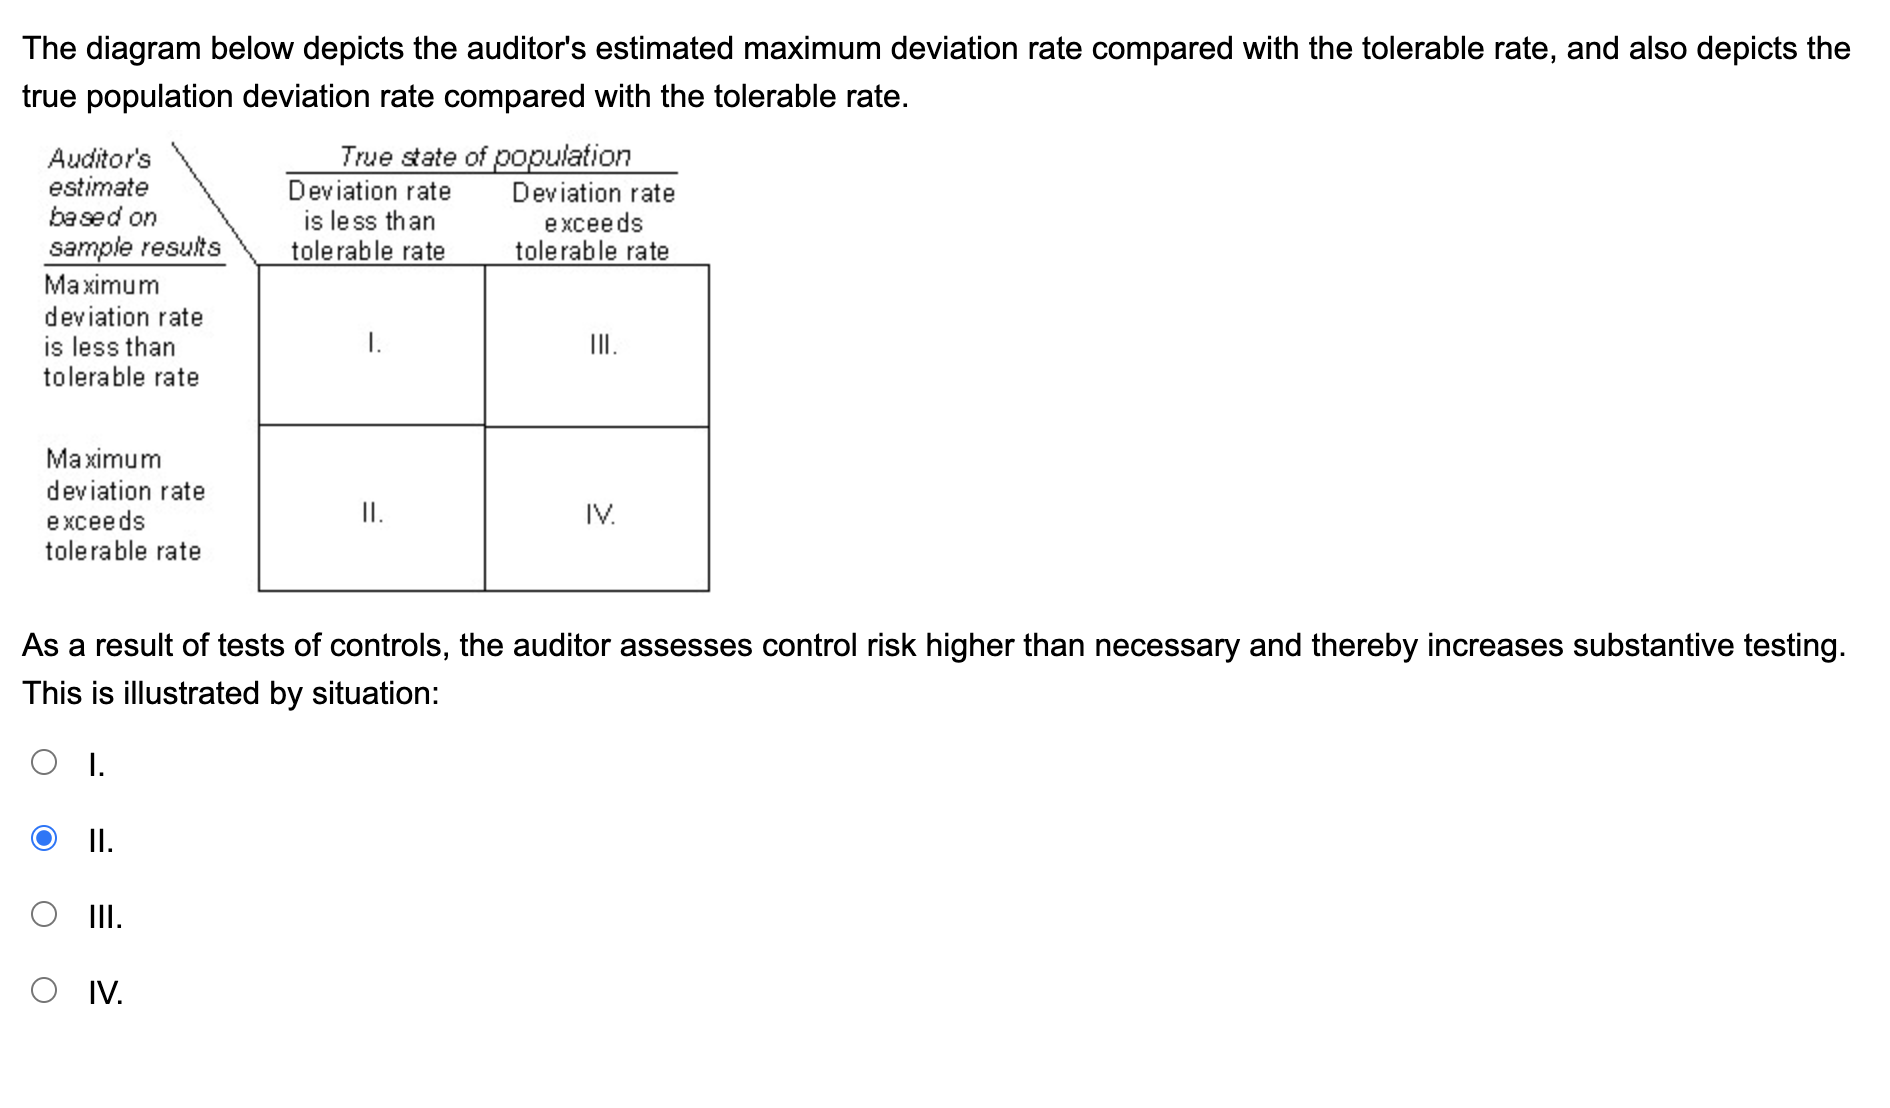
Question: The diagram below depicts the auditor's estimated maximum deviation rate compared with the tolerable rate, and also depicts the true population deviation rate compared with
Step by Step Solution
There are 3 Steps involved in it

Get step-by-step solutions from verified subject matter experts