

Question: The diagram below shows a dataset with 2 classes and 8 data points, each with only one feature value, labeled f. Note that there are
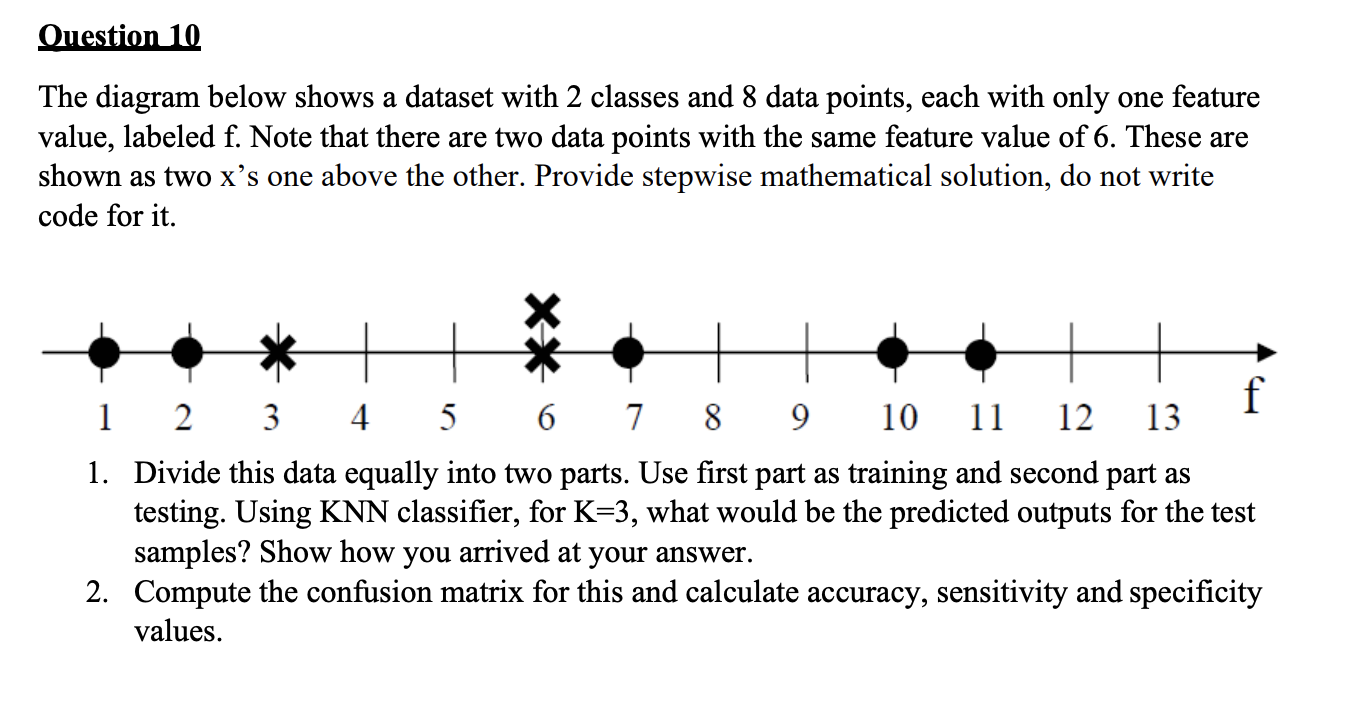
The diagram below shows a dataset with 2 classes and 8 data points, each with only one feature value, labeled f. Note that there are two data points with the same feature value of 6. These are shown as two xs one above the other. Provide stepwise mathematical solution, do not write code for it.
1. Divide this data equally into two parts. Use first part as training and second part as testing. Using KNN classifier, for K=3, what would be the predicted outputs for the test samples? Show how you arrived at your answer.
2. Compute the confusion matrix for this and calculate accuracy, sensitivity and specificity values.
The diagram below shows a dataset with 2 classes and 8 data points, each with only one feature value, labeled f. Note that there are two data points with the same feature value of 6 . These are shown as two x's one above the other. Provide stepwise mathematical solution, do not write code for it. 1. Divide this data equally into two parts. Use first part as training and second part as testing. Using KNN classifier, for K=3, what would be the predicted outputs for the test samples? Show how you arrived at your answer. 2. Compute the confusion matrix for this and calculate accuracy, sensitivity and specificity values
Step by Step Solution
There are 3 Steps involved in it

Get step-by-step solutions from verified subject matter experts