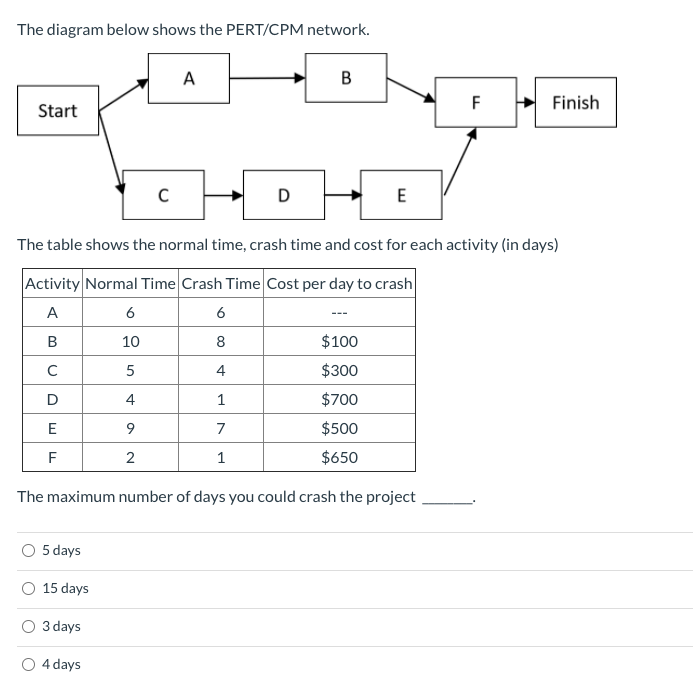
Question: The diagram below shows the PERT/CPM network. A B Start F Finish D E The table shows the normal time, crash time and cost for

The diagram below shows the PERT/CPM network. A B

The diagram below shows the PERT/CPM network. A B Start F Finish D E The table shows the normal time, crash time and cost for each activity (in days) Activity Normal Time Crash Time Cost per day to crash A 6 6 B 10 8 $100 $300 5 4 D 4 1 $700 $500 E 9 7 F 2 1 $650 The maximum number of days you could crash the project 5 days 15 days 3 days 4 days

Step by Step Solution

There are 3 Steps involved in it

1 Expert Approved Answer
Step: 1 Unlock blur-text-image
Question Has Been Solved by an Expert!

Get step-by-step solutions from verified subject matter experts

Step: 2 Unlock
Step: 3 Unlock

Students Have Also Explored These Related General Management Questions!