

Question: The difference between the upper and lower control limits of an X-bar chart for a process is 15 units. Samples of size 7 have been
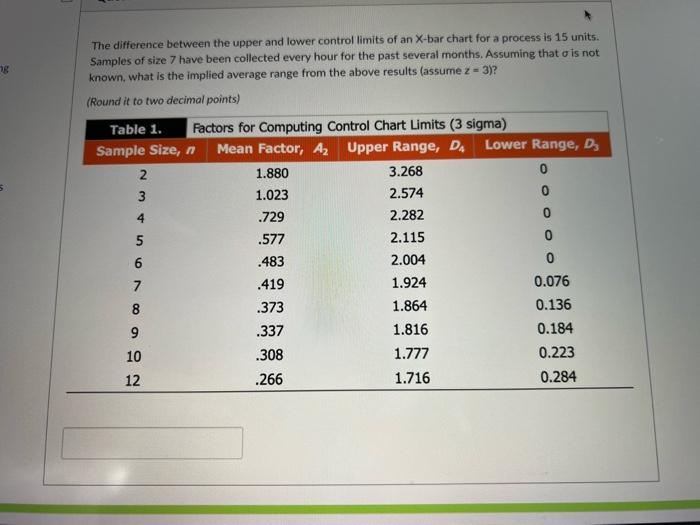
The difference between the upper and lower control limits of an X-bar chart for a process is 15 units. Samples of size 7 have been collected every hour for the past several months. Assuming that is not known, what is the implied average range from the above results (assume z=3 )? (Round it to two decimal points)
Step by Step Solution
There are 3 Steps involved in it
1 Expert Approved Answer
Step: 1 Unlock

Question Has Been Solved by an Expert!
Get step-by-step solutions from verified subject matter experts
Step: 2 Unlock
Step: 3 Unlock