

The dotted line in the following graph shows levels of glucose in a culture of wild-type E,
Fantastic news! We've Found the answer you've been seeking!
Question:
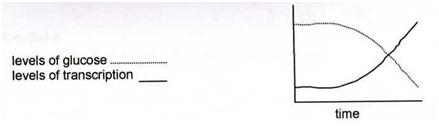
The dotted line in the following graph shows levels of glucose in a culture of wild-type E, coli grown in medium that initially contains both glucose and lactose. The solid line shows levels of transcription of the lac operon. Described what is happening to the culture to the culture and the lac operon, referring to the lac repressor, allolactose, cAMP, and CAP (catabolite activator protein)
Expert Answer:
According to the graph lac operon expression increases with time Lac operon will only transcribe if ... View the full answer

Related Book For 

Posted Date:
