

Question: The Excel file Correlation Matrix Data con tains monthly return data for five ( 5 ) stocks. a. Compute the Correlation Matrix for the five
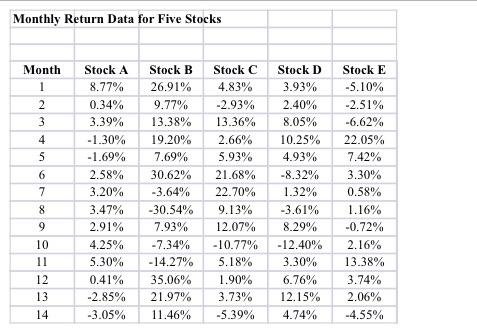
\begin{tabular}{|c|c|c|c|c|c|} \hline \multicolumn{2}{|l|}{ Monthly Return Data for Five Stocks } & \\ \hline & & & & & \\ \hline & & & & & \\ \hline Month & Stock A & Stock B & Stock C & Stock D & Stock E \\ \hline 1 & 8.77% & 26.91% & 4.83% & 3.93% & 5.10% \\ \hline 2 & 0.34% & 9.77% & 2.93% & 2.40% & 2.51% \\ \hline 3 & 3.39% & 13.38% & 13.36% & 8.05% & 6.62% \\ \hline 4 & 1.30% & 19.20% & 2.66% & 10.25% & 22.05% \\ \hline 5 & 1.69% & 7.69% & 5.93% & 4.93% & 7.42% \\ \hline 6 & 2.58% & 30.62% & 21.68% & 8.32% & 3.30% \\ \hline 7 & 3.20% & 3.64% & 22.70% & 1.32% & 0.58% \\ \hline 8 & 3.47% & 30.54% & 9.13% & 3.61% & 1.16% \\ \hline 9 & 2.91% & 7.93% & 12.07% & 8.29% & 0.72% \\ \hline 10 & 4.25% & 7.34% & 10.77% & 12.40% & 2.16% \\ \hline 11 & 5.30% & 14.27% & 5.18% & 3.30% & 13.38% \\ \hline 12 & 0.41% & 35.06% & 1.90% & 6.76% & 3.74% \\ \hline 13 & 2.85% & 21.97% & 3.73% & 12.15% & 2.06% \\ \hline 14 & 3.05% & 11.46% & 5.39% & 4.74% & 4.55% \\ \hline \end{tabular}
Step by Step Solution
There are 3 Steps involved in it

Get step-by-step solutions from verified subject matter experts