

Question: The Excel file Correlation Matrix Data contains monthly return data for four (4) stocks. a. Compute the Correlation Matrix for the four (4) stocks. b.
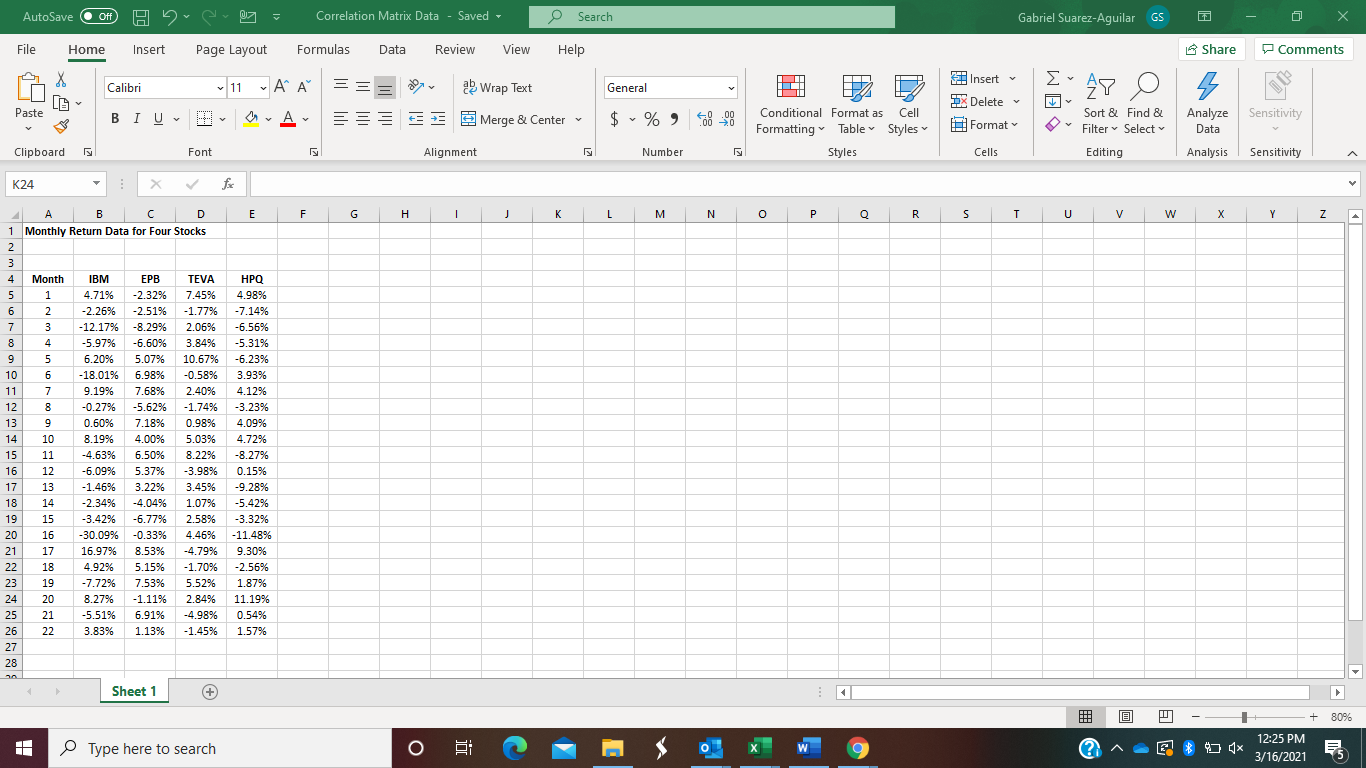
The Excel file Correlation Matrix Data contains monthly return data for four (4) stocks.
a. Compute the Correlation Matrix for the four (4) stocks.
b. All other things being equal, which pair of stocks would reduce portfolio risk the most? c. All other things being equal, which pair of stocks would reduce portfolio risk the least?
AutoSave Off He Correlation Matrix Data - Saved - Search Gabriel Suarez-Aguilar GS File Home Insert Page Layout Formulas Data Review View Help Share Comments Insert Calibri 11 A A == General AY O s a Wrap Text 5 3 Merge & Center DX Delete Paste BIU A y Analyze $ %, 8-20 Sensitivity y Format Conditional Format as Cell Formatting Table Styles Styles Sort & Find & Filter Select Editing Data Clipboard Font Alignment Number Cells Analysis Sensitivity K24 X E F H J J K L M N O P O R s T V w Y Z Z A B C D 1 Monthly Return Data for Four Stocks 2 3 4 Month IBM EPB TEVA 5 1 4.71% -2.32% 7.45% 6 2 -2.26% -2.51% -1.77% 2.770 7 3 -12.17% -8.29% 2. 2.06% 2 8 4 -5.97% -6.60% 3.84% 2 9 5 6.20% 5.07% 10.67% we 10 6 - 18.01% 6.98% -0.58% . 11 7 9.19% 7.68% 2.40% 2004 . S. 12 8 -0.27% -5.62% -1.74% erro wa dan 13 9 0.60% 7.18% 0.98% 10 4.20 14 10 8.19% 4.00% 5.03% 2.22 15 11 -4.63% 6.50% 8.22% 16 12 -6.09% 5.37% -3.98% CA 17 13 -1.46% 3.22% 3.45% 18 14 -2.34% -4.04% 1.07% 19 15 -3.42% -6.77% 2.58% 20 16 -30.09% -0.33% 4.46% 21 17 16.97% 8.53% -4.79% 22 18 4.92% 5.15% -1.70% .. 23 19 -7.72% 7.53% 5.52% 24 20 8.27% -1.11% 2.84% 25 21 -5.51% 6.91% -4.98% 26 22 3.83% 1.13% -1.45% 27 28 2 HPQ 4.98% -7.14% 1.1970 -6.56% WO -5.31% WWE -6.23% 2010 3.93% 4.12% -3.23% 4.09% 2270 4.72% 4.7270 -8.27% 0.15% -9.28% or -5.42% -3.32% -11.48% 9.30% -2.56% 201 1.87% 11.19% 0.54% 1.57% Sheet 1 + + 80% o o Type here to search 2 > o E 12:25 PM 3/16/2021 AutoSave Off He Correlation Matrix Data - Saved - Search Gabriel Suarez-Aguilar GS File Home Insert Page Layout Formulas Data Review View Help Share Comments Insert Calibri 11 A A == General AY O s a Wrap Text 5 3 Merge & Center DX Delete Paste BIU A y Analyze $ %, 8-20 Sensitivity y Format Conditional Format as Cell Formatting Table Styles Styles Sort & Find & Filter Select Editing Data Clipboard Font Alignment Number Cells Analysis Sensitivity K24 X E F H J J K L M N O P O R s T V w Y Z Z A B C D 1 Monthly Return Data for Four Stocks 2 3 4 Month IBM EPB TEVA 5 1 4.71% -2.32% 7.45% 6 2 -2.26% -2.51% -1.77% 2.770 7 3 -12.17% -8.29% 2. 2.06% 2 8 4 -5.97% -6.60% 3.84% 2 9 5 6.20% 5.07% 10.67% we 10 6 - 18.01% 6.98% -0.58% . 11 7 9.19% 7.68% 2.40% 2004 . S. 12 8 -0.27% -5.62% -1.74% erro wa dan 13 9 0.60% 7.18% 0.98% 10 4.20 14 10 8.19% 4.00% 5.03% 2.22 15 11 -4.63% 6.50% 8.22% 16 12 -6.09% 5.37% -3.98% CA 17 13 -1.46% 3.22% 3.45% 18 14 -2.34% -4.04% 1.07% 19 15 -3.42% -6.77% 2.58% 20 16 -30.09% -0.33% 4.46% 21 17 16.97% 8.53% -4.79% 22 18 4.92% 5.15% -1.70% .. 23 19 -7.72% 7.53% 5.52% 24 20 8.27% -1.11% 2.84% 25 21 -5.51% 6.91% -4.98% 26 22 3.83% 1.13% -1.45% 27 28 2 HPQ 4.98% -7.14% 1.1970 -6.56% WO -5.31% WWE -6.23% 2010 3.93% 4.12% -3.23% 4.09% 2270 4.72% 4.7270 -8.27% 0.15% -9.28% or -5.42% -3.32% -11.48% 9.30% -2.56% 201 1.87% 11.19% 0.54% 1.57% Sheet 1 + + 80% o o Type here to search 2 > o E 12:25 PM 3/16/2021
Step by Step Solution
There are 3 Steps involved in it

Get step-by-step solutions from verified subject matter experts