

Question: The excel part holds data for questions 2. Using the data from Devore Ch 10, problem 4, complete the following steps. a. Calculate SST and
The excel part holds data for questions
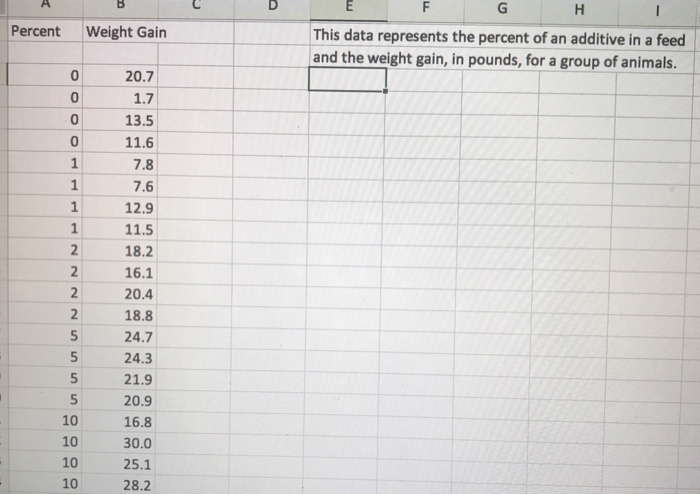
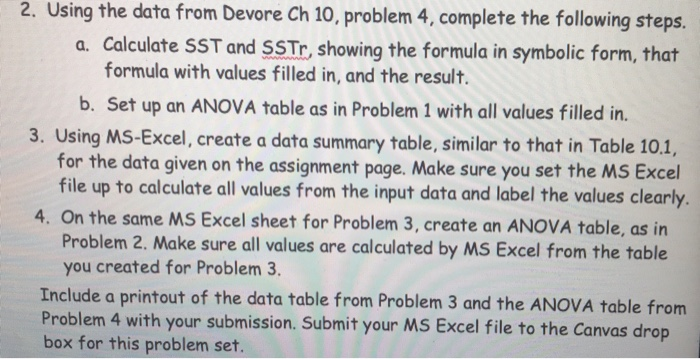
2. Using the data from Devore Ch 10, problem 4, complete the following steps. a. Calculate SST and SSTr, showing the formula in symbolic form, that formula with values filled in, and the result. b. Set up an ANOVA table as in Problem 1 with all values filled in. 3. Using MS-Excel, create a data summary table, similar to that in Table 10.1, for the data given on the assignment page. Make sure you set the MS Excel file up to calculate all values from the input data and label the values clearly. 4. On the same MS Excel sheet for Problem 3, create an ANOVA table, as in Problem 2. Make sure all values are calculated by MS Excel from the table you created for Problem 3 Include a printout of the data table from Problem 3 and the ANOVA table from Problem 4 with your submission, Submit your MS Excel file to the Canvas drop box for this problem set. This data represents the percent of an additive in a feed and the weight gain, in pounds, for a group of animals. PercentWeight Gain 0 20.7 1.7 13.5 11.6 7.8 7.6 12.9 11.5 2 18.2 16.1 20.4 18.8 24.7 24.3 21.9 20.9 16.8 30.0 25.1 28.2 0 0 10 10 10 10 2. Using the data from Devore Ch 10, problem 4, complete the following steps. a. Calculate SST and SSTr, showing the formula in symbolic form, that formula with values filled in, and the result. b. Set up an ANOVA table as in Problem 1 with all values filled in. 3. Using MS-Excel, create a data summary table, similar to that in Table 10.1, for the data given on the assignment page. Make sure you set the MS Excel file up to calculate all values from the input data and label the values clearly. 4. On the same MS Excel sheet for Problem 3, create an ANOVA table, as in Problem 2. Make sure all values are calculated by MS Excel from the table you created for Problem 3 Include a printout of the data table from Problem 3 and the ANOVA table from Problem 4 with your submission, Submit your MS Excel file to the Canvas drop box for this problem set. This data represents the percent of an additive in a feed and the weight gain, in pounds, for a group of animals. PercentWeight Gain 0 20.7 1.7 13.5 11.6 7.8 7.6 12.9 11.5 2 18.2 16.1 20.4 18.8 24.7 24.3 21.9 20.9 16.8 30.0 25.1 28.2 0 0 10 10 10 10
Step by Step Solution
There are 3 Steps involved in it

Get step-by-step solutions from verified subject matter experts