

Question: the excel spread is for the questions! please answer 1-7! thank you! the excel spread corresponds with the question! BT1 . 97000 120000 109000 0.19
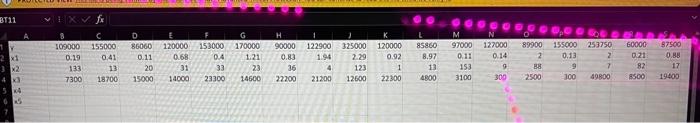

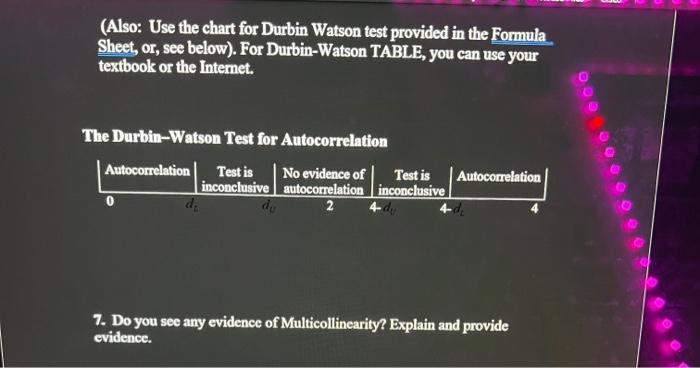
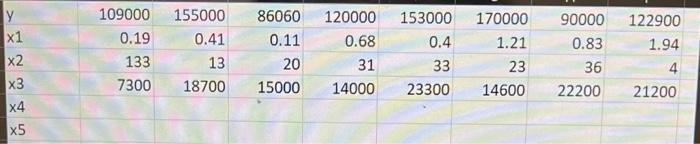
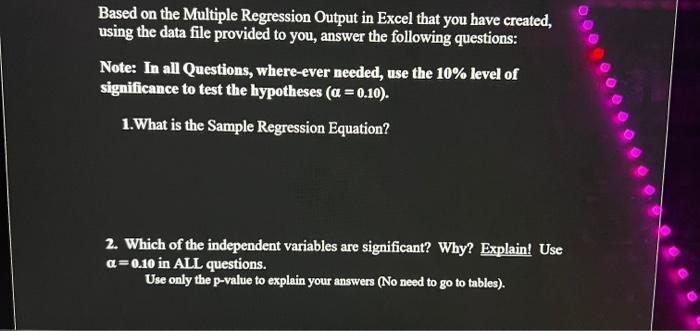
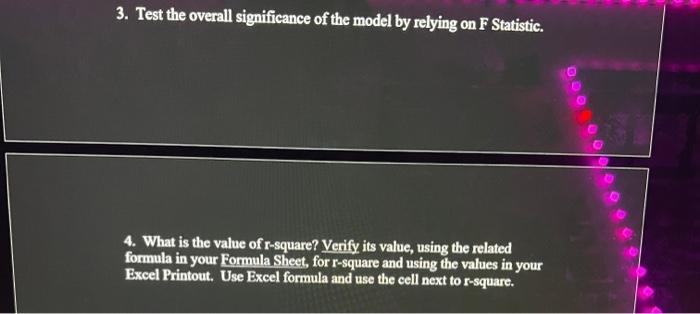

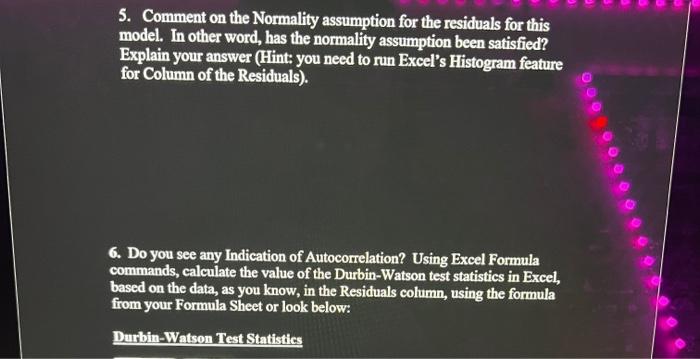
BT1 . 97000 120000 109000 0.19 C 155000 0.41 13 18700 D 86060 0.11 20 15000 x K2 H 90000 0.83 36 22200 N 127000 0.14 0.92 120000 153000 170000 0.68 0.4 1.21 31 33 23 14000 23300 14600 011 L 85860 8.97 13 4800 122900 1.94 4 21200 325000 2.29 123 12600 89900 2 88 2500 155000 0.13 9 100 253750 2 7 49800 60000 021 82 8500 87500 0.88 17 19400 133 1 22300 153 3100 7300 300 4 Major: Based on the Multiple Regression Output in Excel that you have created, using the data file provided to you, answer the following questions: Note: In all Questions, where ever needed, use the 10% level of significance to test the hypotheses (a = 0.10). 1.What is the Sample Regression Equation? 2. Which of the independent variables are significant? Why? Explain! Use a=0.10 in ALL questions. Use only the p-value to explain your answers (No need to go to tables). 3. Test the overall significance of the model by relying on F Statistic. 4. What is the value of r-square? Verify its value, using the related formula in your Formula Sheet, for r-square and using the values in your Excel Printout. Use Excel formula and use the cell next to r-square. 5. Comment on the Normality assumption for the residuals for this model. In other word, has the normality assumption been satisfied? Explain your answer (Hint: you need to run Excel's Histogram feature for Column of the Residuals). @ 0000 6. Do you see any Indication of Autocorrelation? Using Excel Formula commands, calculate the value of the Durbin-Watson test statistics in Excel, based on the data, as you know, in the Residuals column, using the formula from your Formula Sheet or look below: Durbin-Watson Test Statistics (Also: Use the chart for Durbin Watson test provided in the Formula Sheet, or, see below). For Durbin-Watson TABLE, you can use your textbook or the Internet. The Durbin-Watson Test for Autocorrelation Autocorrelation Test is No evidence of Test is Autocorrelation inconclusive autocorrelation inconclusive d 2 000 0 7. Do you see any evidence of Multicollinearity? Explain and provide evidence. 1 2 3 4 5 109000 0.19 133 7300 155000 0.41 13 18700 86060 0.11 20 15000 120000 0.68 31 14000 153000 0.4 33 23300 170000 1.21 23 14600 90000 0.83 36 22200 122900 1.94 4 21200 Based on the Multiple Regression Output in Excel that you have created, using the data file provided to you, answer the following questions: Note: In all Questions, where ever needed, use the 10% level of significance to test the hypotheses (a = 0.10). 1. What is the Sample Regression Equation? 2. Which of the independent variables are significant? Why? Explain! Use a=0.10 in ALL questions. Use only the p-value to explain your answers (No need to go to tables). 3. Test the overall significance of the model by relying on F Statistic. 4. What is the value of r-square? Verify its value, using the related formula in your Formula Sheet, for r-square and using the values in your Excel Printout. Use Excel formula and use the cell next to r-square. (Also: Use the chart for Durbin Watson test provided in the Formula Sheet, or, see below). For Durbin-Watson TABLE, you can use your textbook or the Internet. DO The Durbin-Watson Test for Autocorrelation Autocorrelation Test is No evidence of Test is Autocorrelation inconclusive autocorrelation inconclusive de 2 0 7. Do you see any evidence of Multicollinearity? Explain and provide evidence. 5. Comment on the Normality assumption for the residuals for this model. In other word, has the normality assumption been satisfied? Explain your answer (Hint: you need to run Excel's Histogram feature for Column of the Residuals). 0000000 6. Do you see any Indication of Autocorrelation? Using Excel Formula commands, calculate the value of the Durbin-Watson test statistics in Excel, based on the data, as you know, in the Residuals column, using the formula from your Formula Sheet or look below: Durbin-Watson Test Statistics BT1 . 97000 120000 109000 0.19 C 155000 0.41 13 18700 D 86060 0.11 20 15000 x K2 H 90000 0.83 36 22200 N 127000 0.14 0.92 120000 153000 170000 0.68 0.4 1.21 31 33 23 14000 23300 14600 011 L 85860 8.97 13 4800 122900 1.94 4 21200 325000 2.29 123 12600 89900 2 88 2500 155000 0.13 9 100 253750 2 7 49800 60000 021 82 8500 87500 0.88 17 19400 133 1 22300 153 3100 7300 300 4 Major: Based on the Multiple Regression Output in Excel that you have created, using the data file provided to you, answer the following questions: Note: In all Questions, where ever needed, use the 10% level of significance to test the hypotheses (a = 0.10). 1.What is the Sample Regression Equation? 2. Which of the independent variables are significant? Why? Explain! Use a=0.10 in ALL questions. Use only the p-value to explain your answers (No need to go to tables). 3. Test the overall significance of the model by relying on F Statistic. 4. What is the value of r-square? Verify its value, using the related formula in your Formula Sheet, for r-square and using the values in your Excel Printout. Use Excel formula and use the cell next to r-square. 5. Comment on the Normality assumption for the residuals for this model. In other word, has the normality assumption been satisfied? Explain your answer (Hint: you need to run Excel's Histogram feature for Column of the Residuals). @ 0000 6. Do you see any Indication of Autocorrelation? Using Excel Formula commands, calculate the value of the Durbin-Watson test statistics in Excel, based on the data, as you know, in the Residuals column, using the formula from your Formula Sheet or look below: Durbin-Watson Test Statistics (Also: Use the chart for Durbin Watson test provided in the Formula Sheet, or, see below). For Durbin-Watson TABLE, you can use your textbook or the Internet. The Durbin-Watson Test for Autocorrelation Autocorrelation Test is No evidence of Test is Autocorrelation inconclusive autocorrelation inconclusive d 2 000 0 7. Do you see any evidence of Multicollinearity? Explain and provide evidence. 1 2 3 4 5 109000 0.19 133 7300 155000 0.41 13 18700 86060 0.11 20 15000 120000 0.68 31 14000 153000 0.4 33 23300 170000 1.21 23 14600 90000 0.83 36 22200 122900 1.94 4 21200 Based on the Multiple Regression Output in Excel that you have created, using the data file provided to you, answer the following questions: Note: In all Questions, where ever needed, use the 10% level of significance to test the hypotheses (a = 0.10). 1. What is the Sample Regression Equation? 2. Which of the independent variables are significant? Why? Explain! Use a=0.10 in ALL questions. Use only the p-value to explain your answers (No need to go to tables). 3. Test the overall significance of the model by relying on F Statistic. 4. What is the value of r-square? Verify its value, using the related formula in your Formula Sheet, for r-square and using the values in your Excel Printout. Use Excel formula and use the cell next to r-square. (Also: Use the chart for Durbin Watson test provided in the Formula Sheet, or, see below). For Durbin-Watson TABLE, you can use your textbook or the Internet. DO The Durbin-Watson Test for Autocorrelation Autocorrelation Test is No evidence of Test is Autocorrelation inconclusive autocorrelation inconclusive de 2 0 7. Do you see any evidence of Multicollinearity? Explain and provide evidence. 5. Comment on the Normality assumption for the residuals for this model. In other word, has the normality assumption been satisfied? Explain your answer (Hint: you need to run Excel's Histogram feature for Column of the Residuals). 0000000 6. Do you see any Indication of Autocorrelation? Using Excel Formula commands, calculate the value of the Durbin-Watson test statistics in Excel, based on the data, as you know, in the Residuals column, using the formula from your Formula Sheet or look below: Durbin-Watson Test Statistics
Step by Step Solution
There are 3 Steps involved in it

Get step-by-step solutions from verified subject matter experts