

Question: The excel spreadsheet provides you data from Exhibit 3 and a portion of Exhibit 4. Use Excel functions and the relevant formula and show how
The excel spreadsheet provides you data from Exhibit 3 and a portion of Exhibit 4. Use Excel
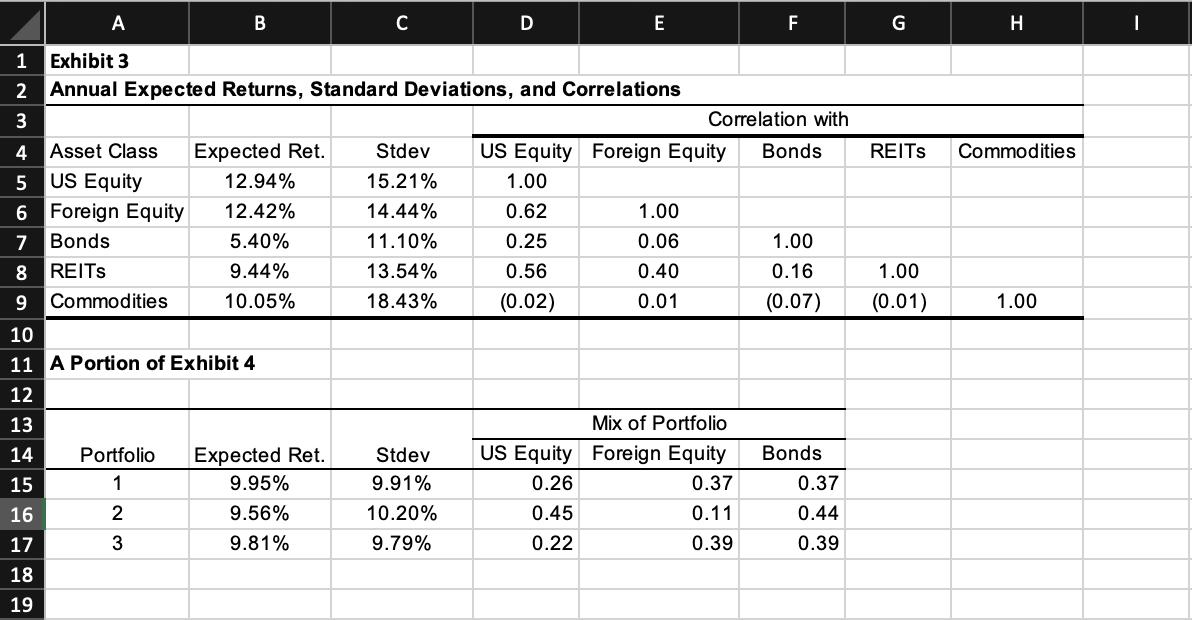
A 1 Exhibit 3 2 Annual Expected Returns, Standard Deviations, and Correlations 3 456 B Asset Class Expected Ret. US Equity 6 Foreign Equity 7 Bonds 8 REITS 9 Commodities 12.94% 12.42% 5.40% 9.44% 10.05% 10 11 A Portion of Exhibit 4 12 13 14 15 16 17 18 19 Portfolio Expected Ret. 1 2 3 C 9.95% 9.56% 9.81% D Stdev 9.91% 10.20% 9.79% E 1.00 0.62 0.25 0.56 (0.02) Stdev US Equity Foreign Equity Bonds 15.21% 14.44% 11.10% 13.54% 18.43% US Equity 0.26 0.45 0.22 1.00 0.06 0.40 0.01 F Correlation with Mix of Portfolio Foreign Equity 0.37 0.11 0.39 1.00 0.16 (0.07) Bonds 0.37 0.44 0.39 G H REITS Commodities 1.00 (0.01) 1.00 I
Step by Step Solution
3.37 Rating (144 Votes )
There are 3 Steps involved in it
A Exhibit 3 This table provides the expected returns standard deviations and correlations of four asset classes US Equity Foreign Equity Bonds and REI... View full answer

Get step-by-step solutions from verified subject matter experts