

Question: THE EXERCISE WILL BE ON FILE PLEASE 4. Ihe relationship between marginal and average costs Consider the following scenario to understand the relationship between marginal
THE EXERCISE WILL BE ON FILE PLEASE
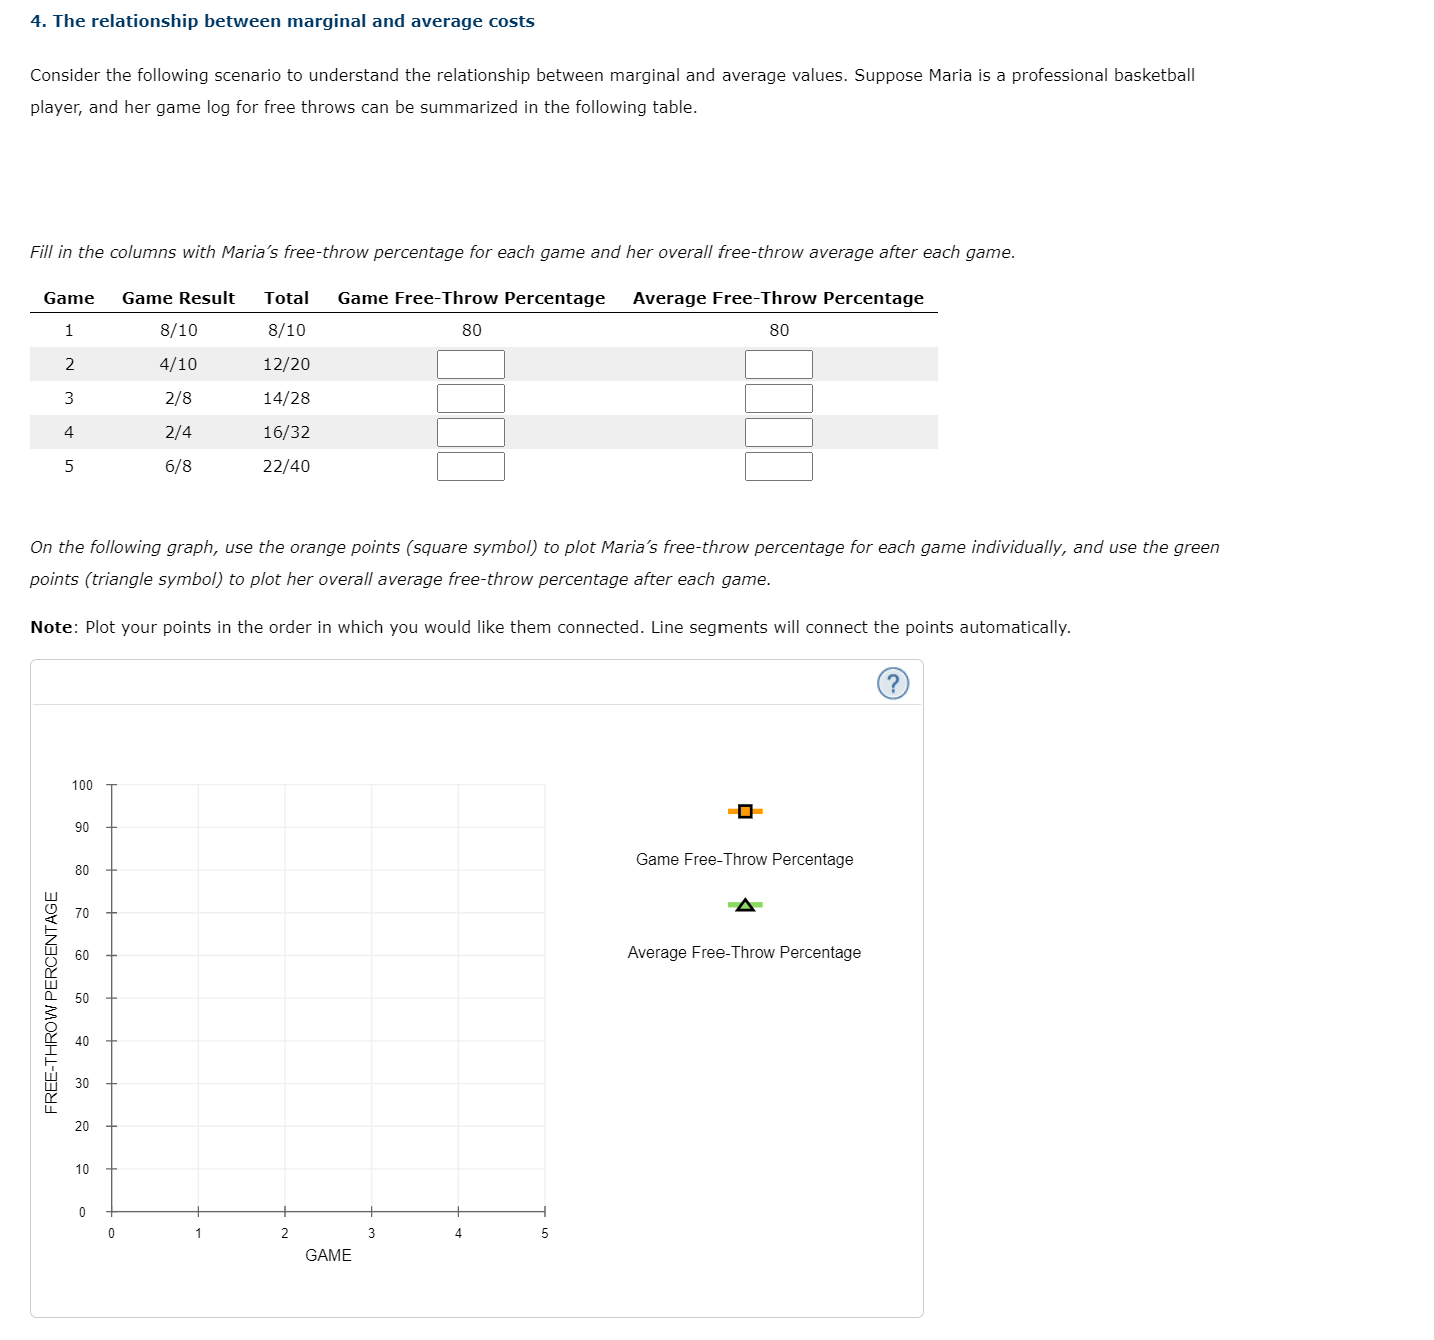
4. Ihe relationship between marginal and average costs Consider the following scenario to understand the relationship between marginal and average values. Suppose Maria is a professional basketball player, and her game log for free throws can be summarized in the following table. Fill in the columns with Maria's freethrow percentage for each game and her overall eethrow average after each game. Game Game Result Total Game FreeThrow Percentage Average FreeThrow Percentage 1 3/10 3/1 0 so 80 2 4/10 1 2/20 E E 3 2/8 14/28 S E 4 2/4 16/32 S E 5 WE 22/40 S E On the following graph, use the orange points (square symbol) to plot Maria's freethrow percentage for each game individually, and use the green pain ts (triangle symbol) to plot her overall average freethrow percentage after each game. Note: Plot your points in the order in which you would like them connected. Line segments will connect the points automatically. 100 -I- 90 A an _ Game FreeeThrow Percentage Lu *- 9 7o E 3 6|) 4 Average FreeThrow Percentage I]! m I]. 5|) _ E II _ I 40 'T H 30 v II LL 2|) 1|) 0 + l l GAM E
Step by Step Solution
There are 3 Steps involved in it

Get step-by-step solutions from verified subject matter experts