

Question: THIS the same exercise i had to take multiple screenshoot to show everything 4. The relationship between marginal and average costs Consider the following scenario
THIS the same exercise i had to take multiple screenshoot to show everything
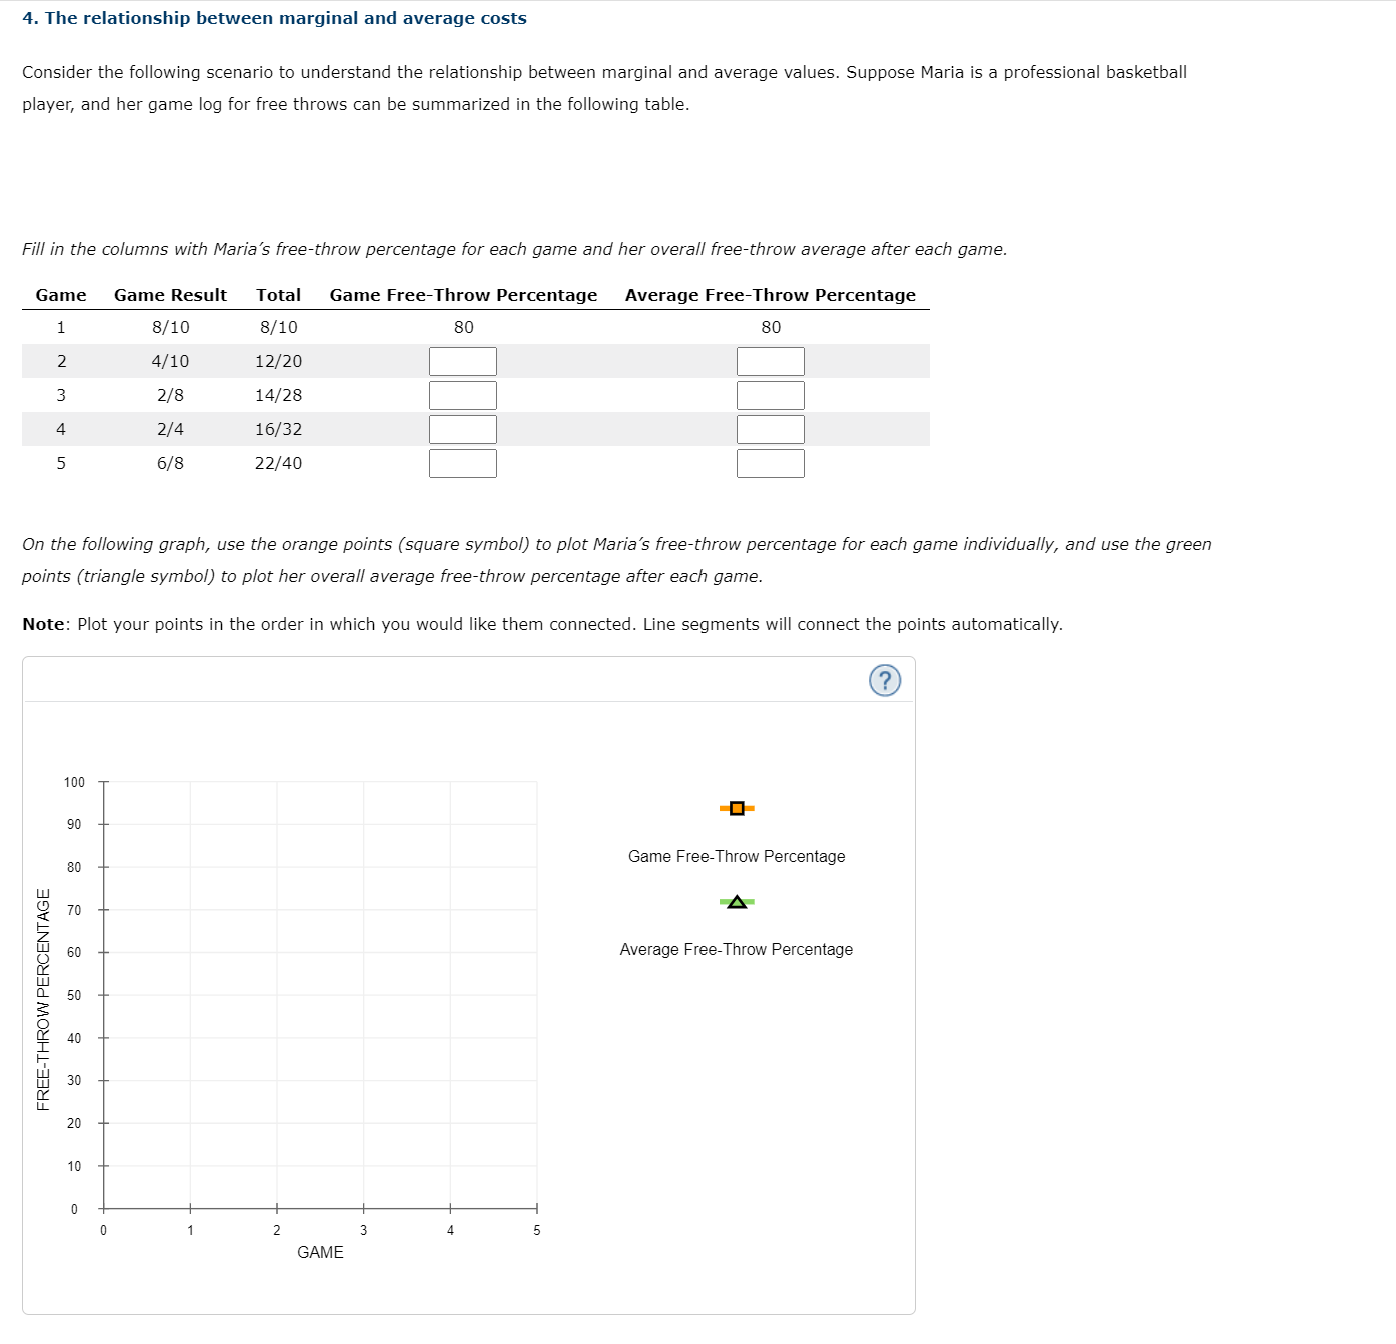
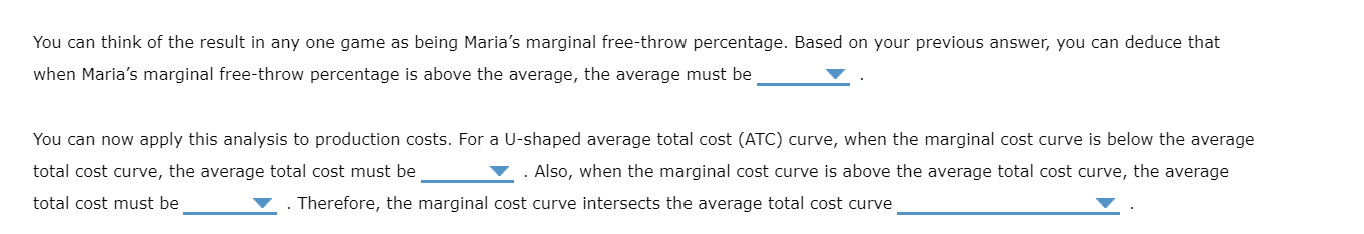
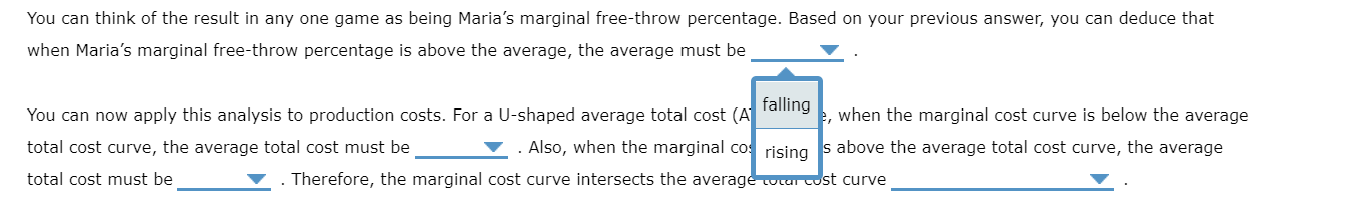
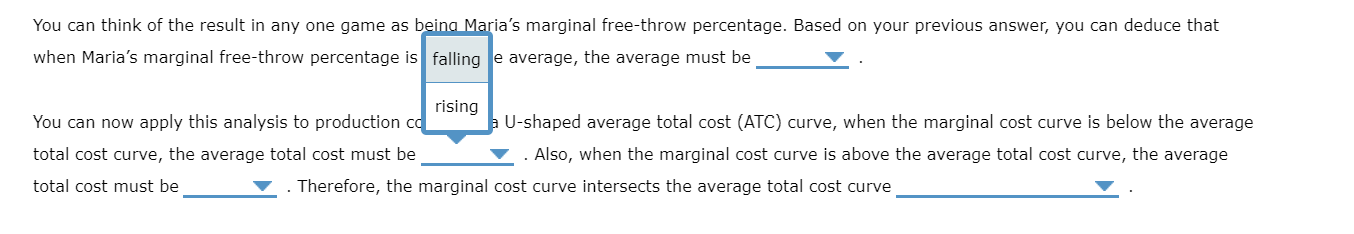
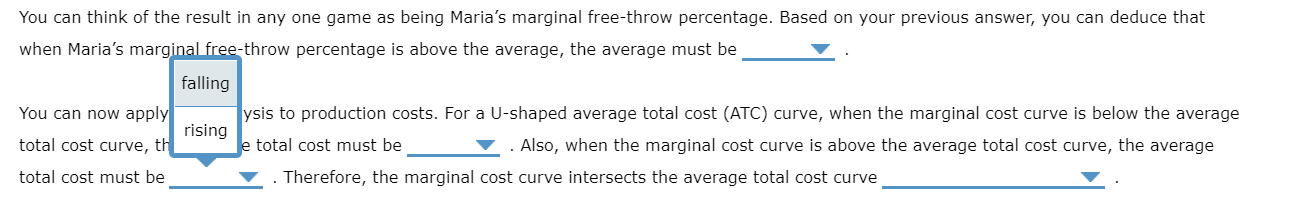
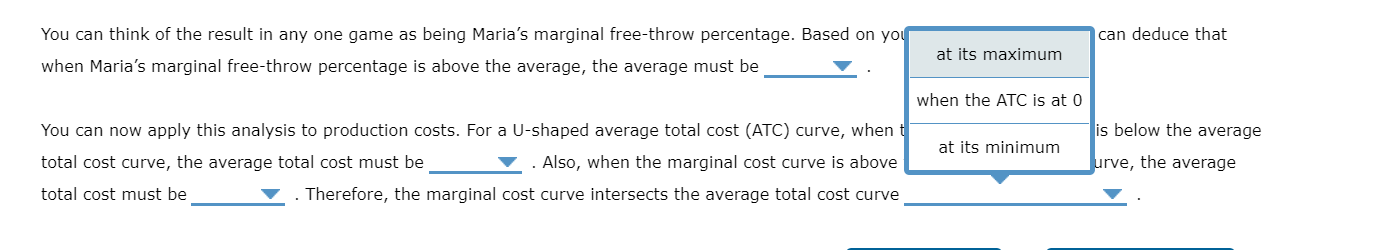
4. The relationship between marginal and average costs Consider the following scenario to understand the relationship between marginal and average values. Suppose Maria is a professional basketball player, and her game log for free throws can be summarized in the following table. Fill in the columns with Maria's free-throw percentage for each game and her overall free-throw average after each game. Game Game Result Total Game Free-Throw Percentage Average Free-Throw Percentage 3/10 8/10 80 80 U A W N 4/10 12/20 2/8 14/28 2/4 16/32 6/8 22/40 On the following graph, use the orange points (square symbol) to plot Maria's free-throw percentage for each game individually, and use the green points (triangle symbol) to plot her overall average free-throw percentage after each game. Note: Plot your points in the order in which you would like them connected. Line segments will connect the points automatically. 100 90 80 Game Free-Throw Percentage FREE-THROW PERCENTAGE 70 A 60 Average Free-Throw Percentage 50 40 30 GAMEYou can think of the result in any one game as being Maria's marginal freethrow percentage. Based on your previous answer, you can deduce that when Maria's marginal freethrow percentage is above the average, the average must be V . You can now apply this analysis to production costs. For a Uishaped average total cost (ATC) curve, when the marginal cost curve is below the average total cost curver the average total cost must be V . Also, when the marginal cost curve is above the average total cost curve, the average total cost must be V . Therefore, the marginal cost curve intersects the average total cost curve V . You can think of the result in any one game as being Maria's marginal freethrow percentage. Based on your previous answer, you can deduce that when Maria's marginal free-throw percentage is above the average, the average must be V . falling . You can now apply this analysis to production costs. For a Uishaped average total cost (A , when the marginal cost curve is below the average total cost curver the average total cost must be V . Also, when the marginal co . above the average total cost curve, the average rising total cost must be 7 . Therefore, the marginal cost curve intersects the averag t curve V . You can think of the result in any one game as b-' I I u . ia's marginal freeithrow percentage. Based on your previous answer, you can deduce that when Maria's marginal freeithrow percentage is falling e average, the average must be V . rising total cost curve, the average total cost must be 7 . Also, when the marginal cost curve is above the average total cost curve, the average You can now apply this analysis to production Cl - Ushaped average total cost (ATC) curve, when the marginal cost curve is below the average total cost must be 'U' . Therefore, the marginal cost curve intersects the average total cost curve V . You can think of the result in any one game as being Maria's marginal freethrow percentage. Based on your previous answer, you can deduce that when Maria's marg' l . - -throw percentage is above the average, the average must be V . falling You can now appl ysis to production costs. For a Uishaped average total cost (ATC) curve, when the marginal cost curve is below the average rising total cost curve, t - total cost must be '7 . Also, when the marginal cost curve is above the average total cost curve, the average total cost must be 1' . Therefore, the marginal cost curve intersects the average total cost curve V . You can think of the result in any one game as being Maria's marginal freethrow percentage. Based on yo can deduce that at its maxi mum when Maria's marginal freethrow percentage is above the average, the average must be 7 . when the ATC is at 0 You can now apply this analysis to production costs. For a Ushaped average total cost (ATC) curve, when I is below the average at its minimum total cost curve, the average total cost must be V . Also, when the marginal cost curve is above rve, the average total cost must be '7 . Therefore, the marginal cost curve intersects the average total cost curve V
Step by Step Solution
There are 3 Steps involved in it

Get step-by-step solutions from verified subject matter experts