

Question: The expected returns for three assets are shown in the table below: Year Asset A Asset B Asset 2016 16% 175 14% 2017 17% 16%
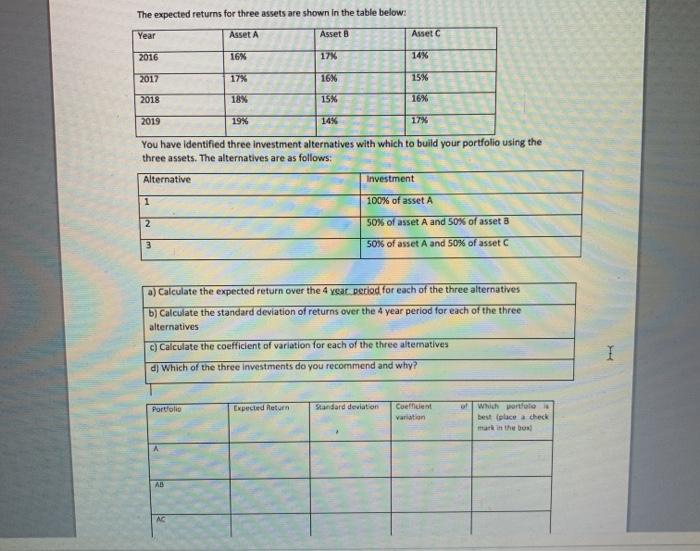
The expected returns for three assets are shown in the table below: Year Asset A Asset B Asset 2016 16% 175 14% 2017 17% 16% 15% 2018 18% 15% 16% 2019 19% 14% 17% You have identified three investment alternatives with which to build your portfolio using the three assets. The alternatives are as follows: Alternative Investment 1 100% of asset A 2 50% of asset A and 50% of asset B 50% of asset A and 50% of asset a) Calculate the expected return over the 4 year period for each of the three alternatives b) Calculate the standard deviation of returns over the 4 year period for each of the three alternatives c) Calculate the coefficient of variation for each of the three altematives I d) Which of the three investments do you recommend and why? Portfolio Expected Return Standard deviation Coefent Variation of which portfolio best place a check mark in the box AC
Step by Step Solution
There are 3 Steps involved in it

Get step-by-step solutions from verified subject matter experts