

Question: out References Mailings Review View Help Question 1 - Portfolio analysis The expected returns for three assets are shown in the table below: Year 2016
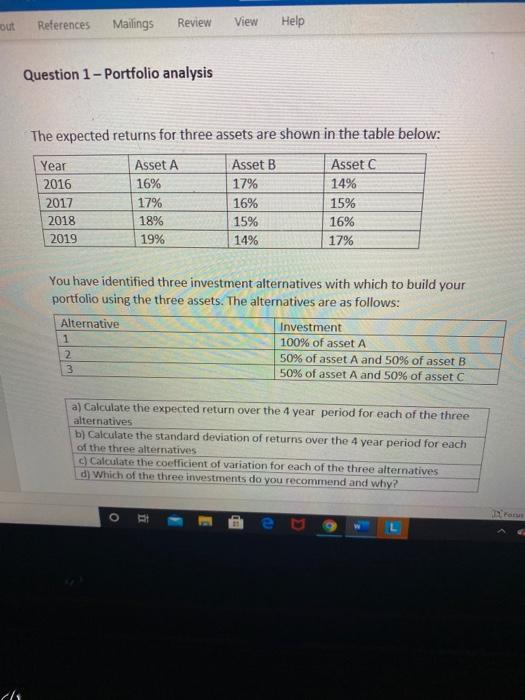
out References Mailings Review View Help Question 1 - Portfolio analysis The expected returns for three assets are shown in the table below: Year 2016 2017 2018 2019 Asset A 16% 17% 18% 19% Asset B 17% 16% 15% 14% Asset C 14% 15% 16% 17% You have identified three investment alternatives with which to build your portfolio using the three assets. The alternatives are as follows: Alternative 1 2 3 Investment 100% of asset A 50% of asset A and 50% of asset B 50% of asset A and 50% of asset C a) Calculate the expected return over the 4 year period for each of the three alternatives b) Calculate the standard deviation of returns over the 4 year period for each of the three alternatives c) Calculate the coefficient of variation for each of the three alternatives d) Which of the three investments do you recommend and why? co
Step by Step Solution
There are 3 Steps involved in it

Get step-by-step solutions from verified subject matter experts