

Question: The figure below depicts the schedule for a small project. The budgeted cost is shown within the schedule bar for each activity. For the sake
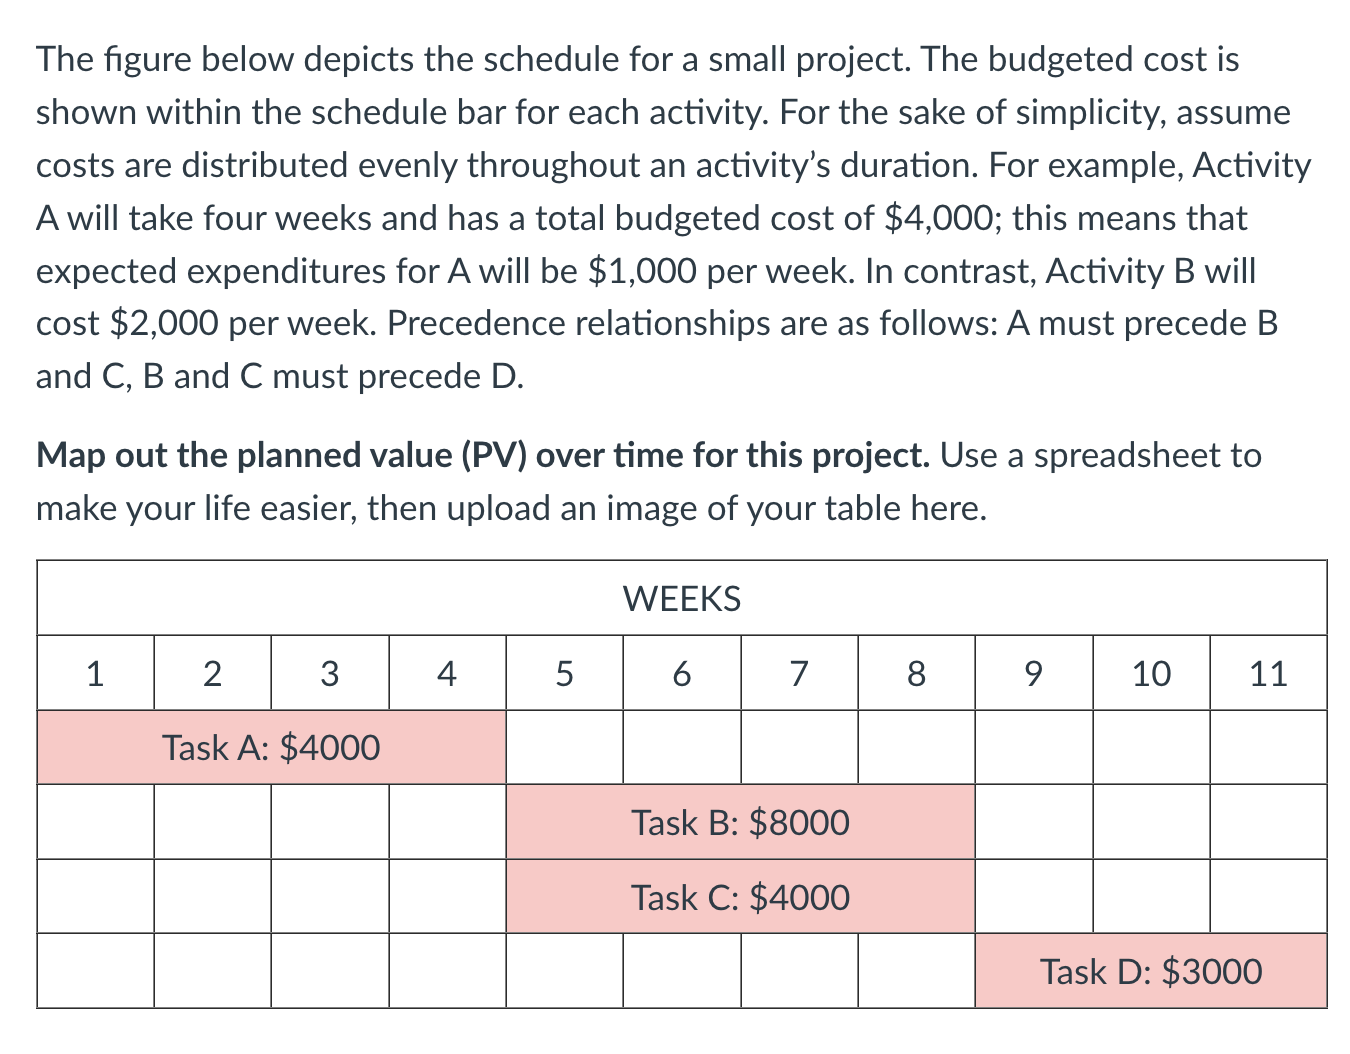
The figure below depicts the schedule for a small project. The budgeted cost is
shown within the schedule bar for each activity. For the sake of simplicity, assume
costs are distributed evenly throughout an activity's duration. For example, Activity
A will take four weeks and has a total budgeted cost of $; this means that
expected expenditures for A will be $ per week. In contrast, Activity B will
cost $ per week. Precedence relationships are as follows: A must precede B
and C B and C must precede D
Map out the planned value PV over time for this project. Use a spreadsheet to
make your life easier, then upload an image of your table here.
Step by Step Solution
There are 3 Steps involved in it
1 Expert Approved Answer
Step: 1 Unlock

Question Has Been Solved by an Expert!
Get step-by-step solutions from verified subject matter experts
Step: 2 Unlock
Step: 3 Unlock