

Question: The figure below depicts the schedule for a small information technology project. The budgeted cost is shown within the schedule bar for each activity. For
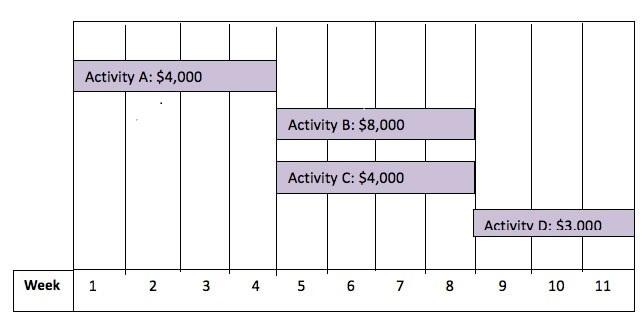
The figure below depicts the schedule for a small information technology project. The budgeted cost is shown within the schedule bar for each activity. For the sake of simplicity, assume costs are distributed evenly throughout an activity’s duration. For example, Activity A will take four weeks and has a total budgeted cost of $4,000. Consequently, expected expenditures for A will be $1,000 per week. In contrast, Activity B will cost $2,000 per week. Precedence relationships are as follows: A must precede B and C, B and C must precede D.
Assume costs and earned value are incurred in a linear fashion. For example, if A took five weeks and cost $5,000, the incremental cost would be $1,000 per week. Earned value accumulates linearly as follows: A is valued at $4,000 and took 5 weeks, so EV for A accumulated at a rate of 20 percent per week or $800 per week.
Assume six weeks of project work have passed. Team members have reported progress and expenditures as follows:
Activity A started on time but took five weeks and is 100 percent complete at a cost of $5,000.
Start dates for B and C were delayed by one week because A took an extra week, so both started on Week 6.
At the end of Week 6, Activity B is 50 percent complete and has cost $5,000.
At the end of Week 6, Activity C is 20 percent complete and has cost $3,000.
Calculate the following:
Total Budgeted Cost (TBC)
Cumulative Budgeted Cost (CBC)
Cumulative Actual Cost (CAC)
Cumulative Earned Value (CEV)
Cost Performance Index (CPI)
Cost variance (CV)
Week Activity A: $4,000 1 2 3 st Activity B: $8,000 Activity C: $4,000 5 6 7 Activity D: $3.000 8 9 10 11
Step by Step Solution
3.60 Rating (171 Votes )
There are 3 Steps involved in it
Lets break down the calculations step by step 1 Total Budgeted Cost TBC Add up the budgeted costs of ... View full answer

Get step-by-step solutions from verified subject matter experts