

Question: The figure below illustrates four different sampling distributions for a sample mean coming from the same population. Both have exactly the same mean however their
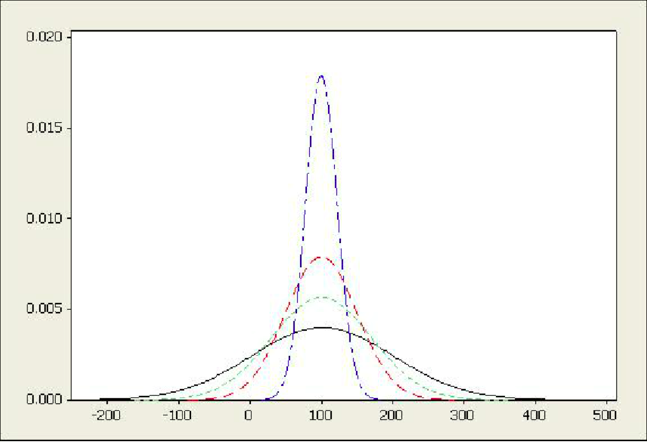
The figure below illustrates four different sampling distributions for a sample mean coming from the same population. Both have exactly the same mean however their standard deviations are different. One sampling distribution has a sample size of 25 another has a sample size of 50, another 100 and the last one 500. The graph that is the shortest and more spread out has which sample size?
\f
Step by Step Solution
There are 3 Steps involved in it
1 Expert Approved Answer
Step: 1 Unlock

Question Has Been Solved by an Expert!
Get step-by-step solutions from verified subject matter experts
Step: 2 Unlock
Step: 3 Unlock