

Question: The figure below represents the equilibrium market (E) between the demand and supply of tanning services. The government sets an excise tax on this service

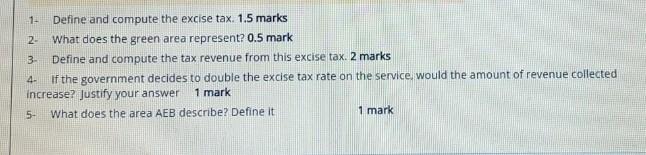
The figure below represents the equilibrium market (E) between the demand and supply of tanning services. The government sets an excise tax on this service in such a way that the price paid by the buyer increases by 10% and the price received by the seller decreases by 10$ Price of tanning services (S) 70 60 S 50 E E 40 30 20 10 0 1,000 2000 3,000 Quantity of tanning services 1- Define and compute the excise tax. 1.5 marks 2- What does the green area represent? 0.5 mark 3- Define and compute the tax revenue from this excise tax. 2 marks 4- If the government decides to double the excise tax rate on the service, would the amount of revenue collected increase? Justify your answer 1 mark 5- What does the area AEB describe? Define it 1 mark
Step by Step Solution
There are 3 Steps involved in it
1 Expert Approved Answer
Step: 1 Unlock

Question Has Been Solved by an Expert!
Get step-by-step solutions from verified subject matter experts
Step: 2 Unlock
Step: 3 Unlock