

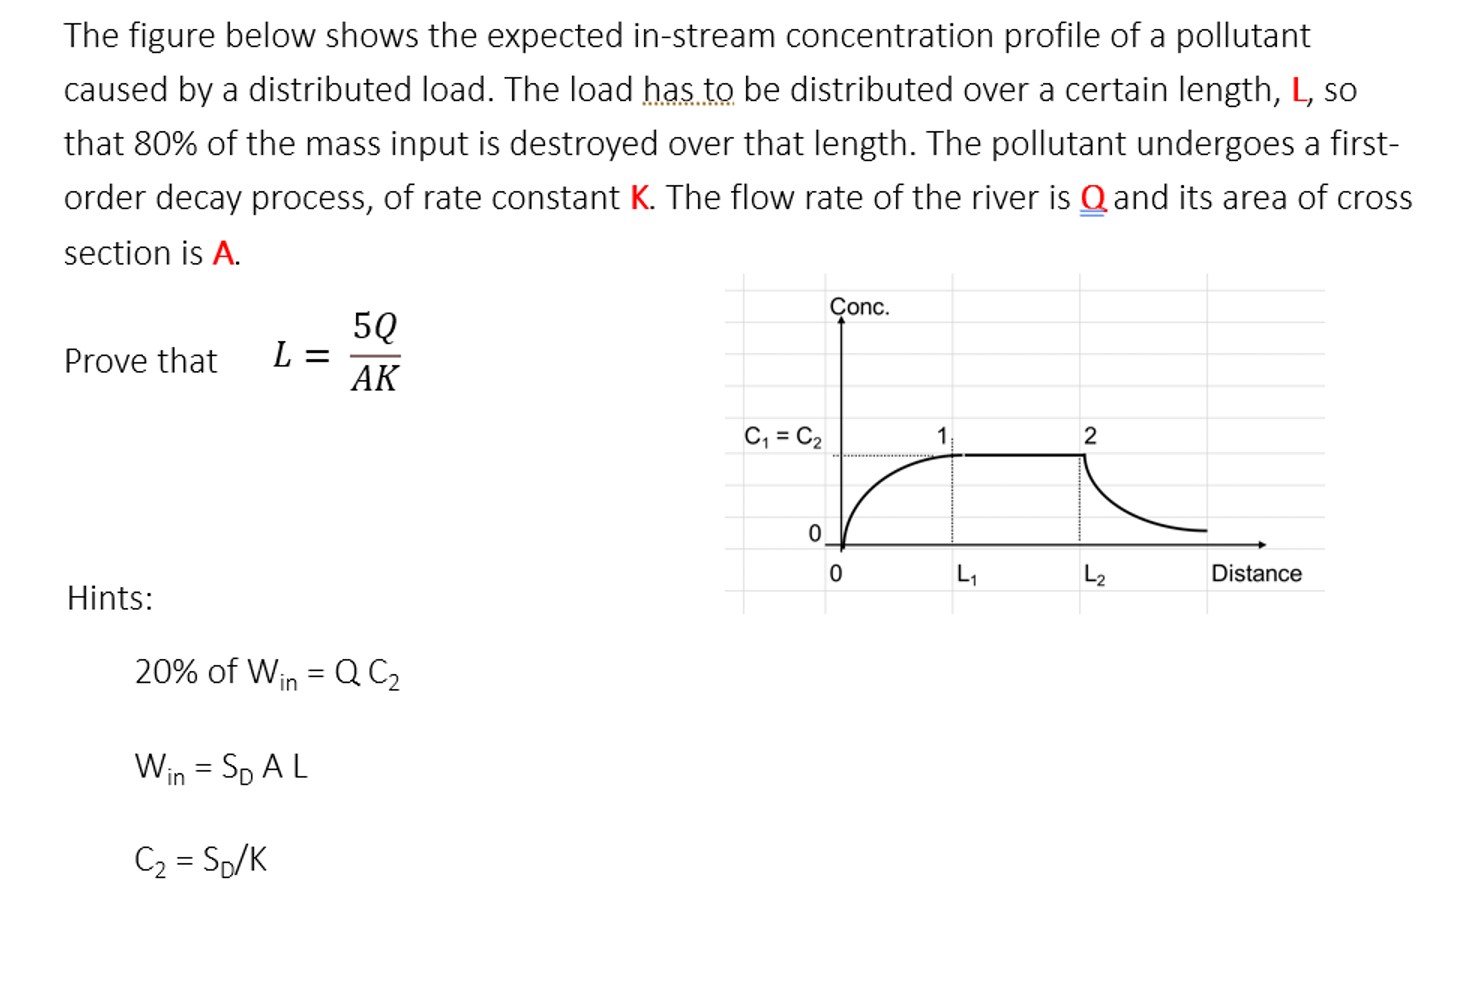
Question: The figure below shows the expected in - stream concentration profile of a pollutant caused by a distributed load. The load has to be distributed
The figure below shows the expected instream concentration profile of a pollutant
caused by a distributed load. The load has to be distributed over a certain length, L so
that of the mass input is destroyed over that length. The pollutant undergoes a first
order decay process, of rate constant The flow rate of the river is and its area of cross
section is
Prove that
Hints:
Step by Step Solution
There are 3 Steps involved in it
1 Expert Approved Answer
Step: 1 Unlock

Question Has Been Solved by an Expert!
Get step-by-step solutions from verified subject matter experts
Step: 2 Unlock
Step: 3 Unlock