

Question: The figure below shows two loops: loop 1 (front page) and loop 2 (back page). Loop 1 initially has a steady current flow clockwise, whereas
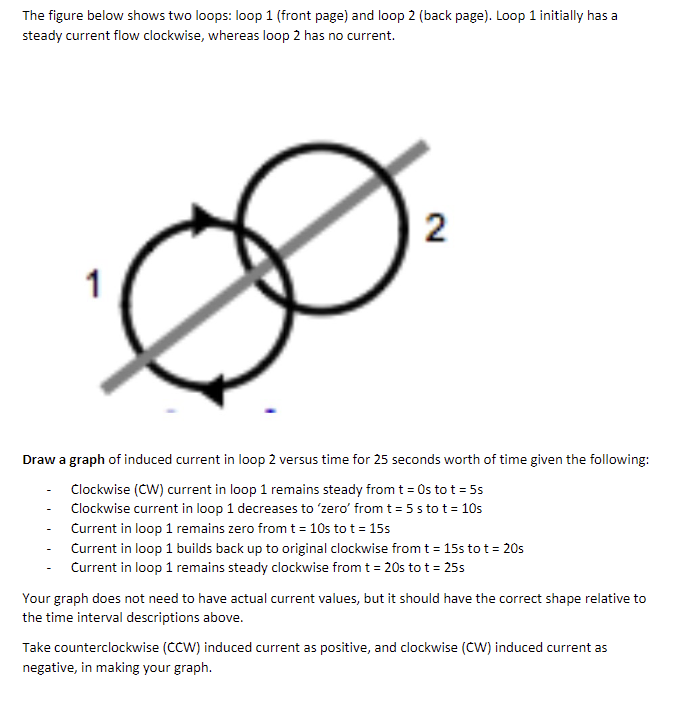

The figure below shows two loops: loop 1 (front page) and loop 2 (back page). Loop 1 initially has a steady current flow clockwise, whereas loop 2 has no current. Draw a graph of induced current in loop 2 versus time for 25 seconds worth of time given the following: Clockwise (CW) current in loop 1 remains steady from t = 0s to t = 5s Clockwise current in loop 1 decreases to 'zero' from t = 5 s to t = 10s Current in loop 1 remains zero from t = 10s to t = 15s Current in loop 1 builds back up to original clockwise from t = 15s to t = 20s Current in loop 1 remains steady clockwise from t = 20s to t = 25s Your graph does not need to have actual current values, but it should have the correct shape relative to the time interval descriptions above. Take counterclockwise (CCW) induced current as positive, and clockwise (CW) induced current as negative, in making your graph
Step by Step Solution
There are 3 Steps involved in it

Get step-by-step solutions from verified subject matter experts