

Question: the figure below. The cell's formula is defined at top in the f, line (the formula bar). If we assume that column B represents the
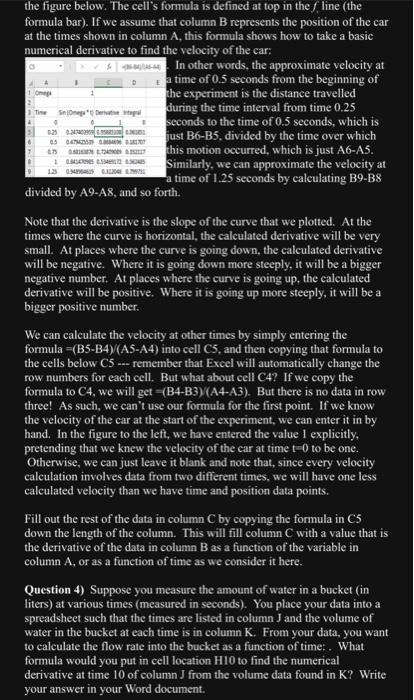
the figure below. The cell's formula is defined at top in the f, line (the formula bar). If we assume that column B represents the position of the car at the times shown in column A, this formula shows how to take a basic numerical derivative to find the velocity of the car: a5.5 as . In other words, the approximate velocity at 1. A D a a time of 0.5 seconds from the beginning of 1 ones the the experiment is the distance travelled 4 seconds to the time of 0.5 seconds, which is 3. I casoss csuenn ives similarly, we can approximate the velocity at divided by A9A8, and so forth. Note that the derivative is the slope of the curve that we plotted. At the times where the curve is horizontal, the calculated derivative will be very small. At places where the curve is going down, the calculated derivative will be negative. Where it is going down more steeply, it will be a bigger negative number. At places where the curve is going up, the calculated derivative will be positive. Where it is going up more steeply, it will be a bigger positive number. We can calculate the velocity at other times by simply entering the formula =(B5B4)/(A5A4) into cell C5, and then copying that formula to the cells below C5 ... remember that Excel will automatically change the row numbers for each cell. But what about cell C4? If we copy the formula to C4, we will get =(B4B3)(A4A3). But there is no data in row three! As such, we can't use our formula for the first point. If we know the velocity of the car at the start of the experiment, we can enter it in by hand. In the figure to the left, we have entered the value 1 explicitly, pretending that we knew the velocity of the car at time t=0 to be one. Otherwise, we can just leave it blank and note that, since every velocity calculation involves data from two different times, we will have one less calculated velocity than we have time and position data points. Fill out the rest of the data in column C by copying the formula in C5 down the length of the column. This will fill column C with a value that is the derivative of the data in column B as a function of the variable in column A, or as a function of time as we consider it here. Question 4) Suppose you measure the amount of water in a bucket (in liters) at various times (measured in seconds). You place your data into a spreadsheet such that the times are listed in column J and the volume of water in the bucket at each time is in column K. From your data, you want to calculate the flow rate into the bucket as a function of time: . What formula would you put in cell location H10 to find the numerical derivative at time 10 of column J from the volume data found in K ? Write your answer in your Word document
Step by Step Solution
There are 3 Steps involved in it

Get step-by-step solutions from verified subject matter experts