Question: The figure below was taken from a Module 3 ppt slide and shows the returns of various asset classes ranked from highest to lowest during
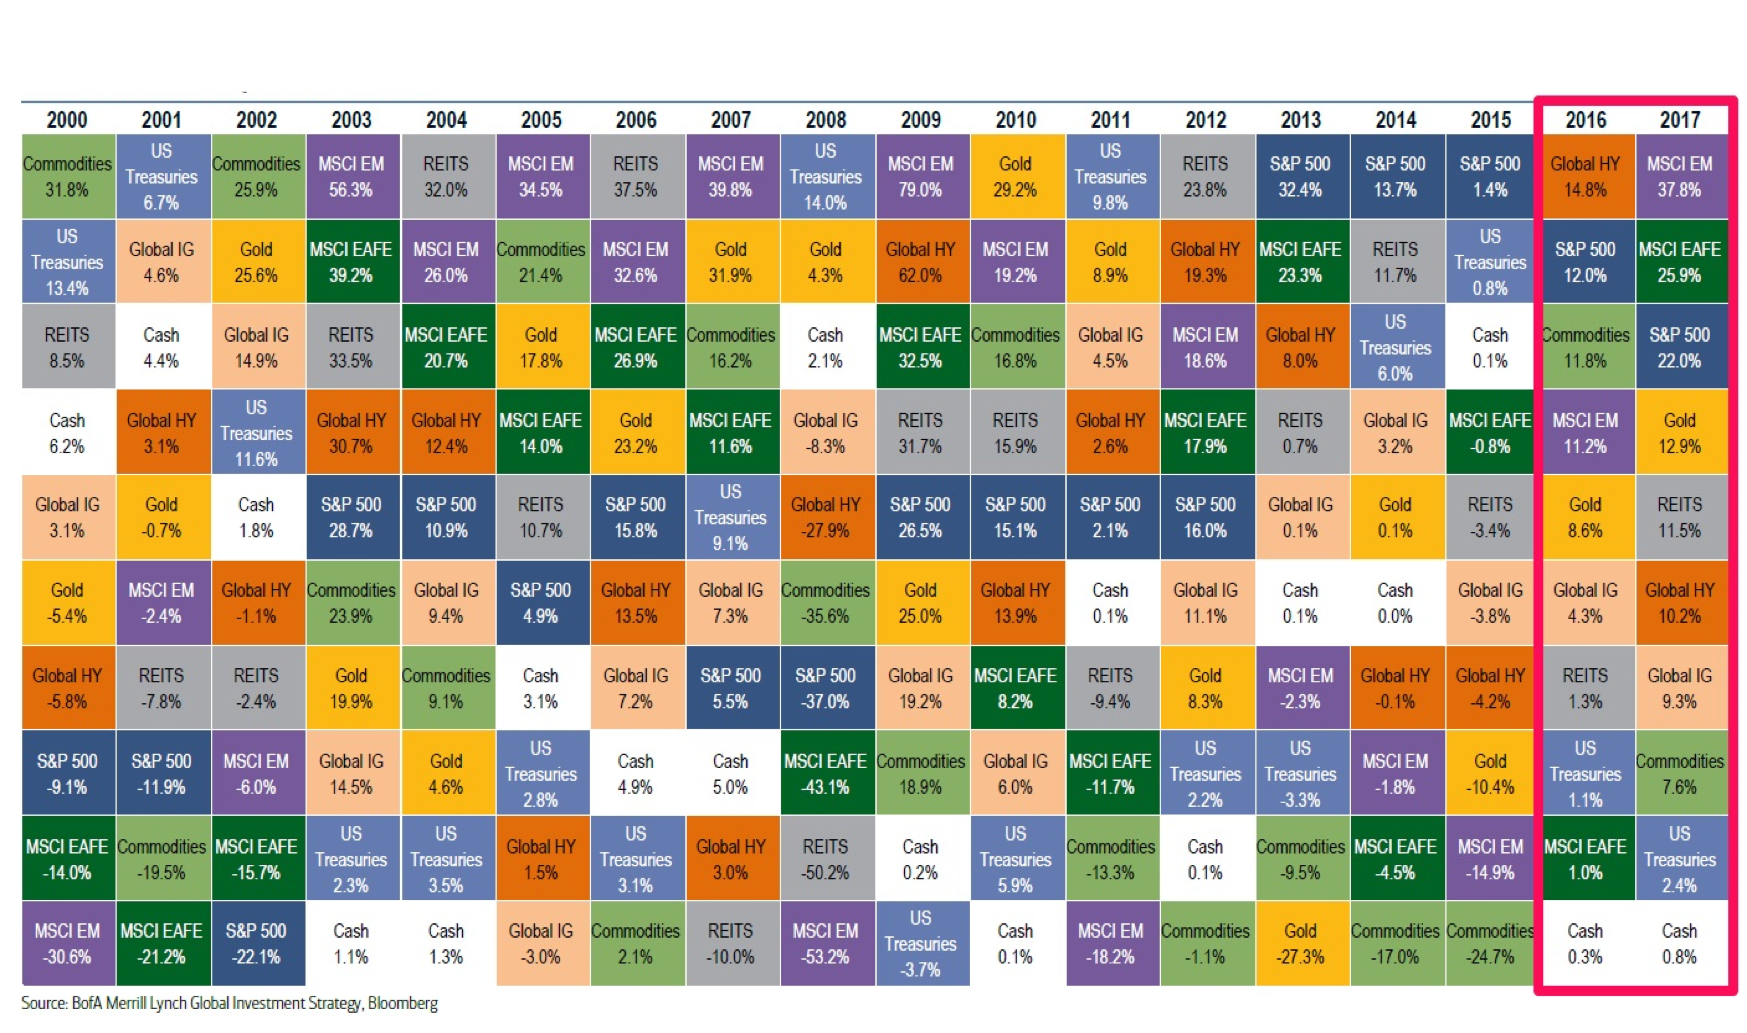
The figure below was taken from a Module 3 ppt slide and shows the returns of various asset classes ranked from highest to lowest during each year from 2000 to 2017. Each asset class is represented by a different color. For example, the white box shows cash returns; the light green box shows commodity returns; the dark blue box shows S&P 500 returns and so on.
Recall that one of the implications of "no free lunch" is the risk vs. return trade-off, where higher risk assets have higher expected returns and lower risk assets have lower expected returns. If this were to hold true each year, one would expect returns of riskier assets to rank amongst highest each year and returns less risky assets to rank amongst the lowest.
The color pattern in the figure below is random.Meaning that in any given year, returns of less risky assets may or may not exceed that of higher risk assets. For example, in 2000, 2001 & 2008, US Treasury bonds & cash (less risky assets) had higher returns than that of the S&P 500 & MSCI-EAFE (higher risk assets).
Reconcile this phenomenon with the risk vs. return trade-off.Does this violate "no free lunch"? Explain.
2001 2002 2003 2004 2005 2006 2007 2008 2009 2010 2011 2012 2013 2014 2015 2016 2017 US US US Commodities Commodities MSCI EM REITS MSCI EM REITS MSCI EM S&P 500 S&P 500 Global HY MSCI EM 56.3% 32.0% 34.5% 37.5% 39.8% Treasuries MSCI EM Gold Treasuries S&P 500 31.8% 25.9% 32.4% 13.7% 1.4% 14.8% 37.8% 14.0% 79.0% 9.8% 23.8% US Global HY Global HY REITS US Global IG Gold MSCI EAFE Commodities MSCI EM Gold MSCI EM Treasuries S&P 500 MSCI EAFE Treasuries 4.6% 25.6% 39.2% 26.0% 21.4% 32.6% 31.9% 62.0% 19.2% 8.9% 19.3% 23.3% 11.7% 12.0% 25.9% 13.4% 0.8% REITS Global IG REITS MSCI EAFE Gold MSCI EAFE Commodities Cash MSCI EAFE Commodities Global IG MSCI EM Global HY US Cash Commodities S&P 500 8.5% 4.4% 14.9% 33.5% 20.7% 17.8% 26.9% 16.2% 2.1% 16.8% 4.5% 18.6% 8.0% 11.8% 22.0% Global HY US Treasuries Global HY MSCI EAFE MSCI EAFE Global IG REITS REITS Global HY MSCI EAFE REITS Global IG MSCI EAFE MSCIEM Gold 6.2% 3.1% 12.4% 14.0% 23.2% 11.6% -8.3% 31.7% 15.9% 2.6% 17.9% 0.7% 3.2% 0.8% 11.2% 12.9% 11.6% US Global IG Gold Cash S&P 500 REITS S&P 500 S&P 500 S&P 500 S&P 500 S&P 500 Global IG Gold REITS Gold REITS 3.1% 1.8% 28.7% 10.9% 10.7% 15.8% -27.9% 26.5% 15.1% 0.1% 0.1% 8.6% 11.5% Gold MSCI EM Global HY Commodities Global IG S&P 500 Global HY Commodities Gold Global HY Cash Global IG Cash Cash Global IG Global IG -2.4% 4.9% 13.5% 35.6% 25.0% 13.9% 0.1% 11.1% 0.1% 3.8% 10.2% Global HY REITS REITS Gold Commodities Cash Global IG S&P 500 S&P 500 Global IG MSCI EAFE REITS Gold MSCI EM Global HY Global HY REITS Global IG -7.8% 19.9% 3.1% 5.5% -37.0% 19.2% 8.2% 2.3% -0.1% S&P 500 MSCI EM MSCI EAFE Commodities Global IG US Global IG US US S&P 500 Cash Treasuries MSCI EM Gold US -9.1% -6.0% 14.5% 5.0% 43.1% 18.9% 6.0% 3.3% -1.8% -10.4% Treasuries US US US US Commodities MSCI EAFE MSCI EM MSCI EAFE US MSCI EAFE Commodities MSCI EAFE Global HY Treasuries Global HY REITS Treasuries Commodities -19.5% Treasuries Treasuries -13.3% -9.5% -14.9% 2.3% 3.0% 50.2% S&P 500 Cash Global IG MSCI EM US Treasuries Cash MSCI EM Commodities Gold Commodities Commodities Cash -30.6% -21.2% -22.1% 2.1% -10.0% -53.2% -24.7% 0.8% -3.7% 0.1% -1.1% -27.3% -17.0% 0.3% Source: BofA Merrill Lynch Global Investment Strategy, Bloomberg