

Question: the question is basically does it violate the risk vs return trade off if a less risky asset had higher returns than a higher risk
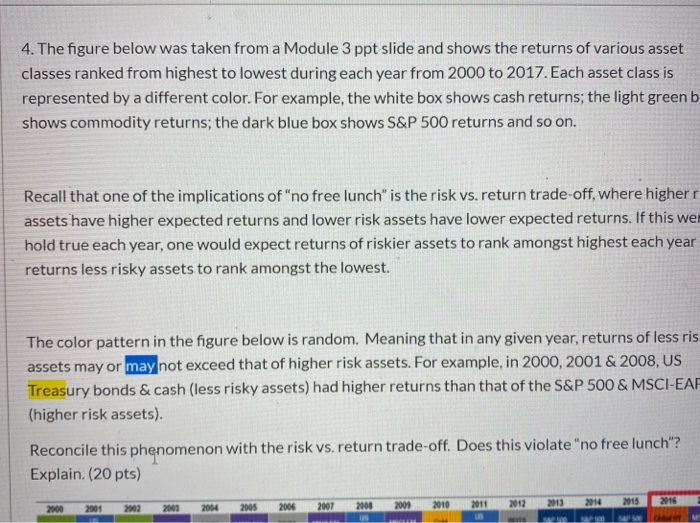
4. The figure below was taken from a Module 3 ppt slide and shows the returns of various asset classes ranked from highest to lowest during each year from 2000 to 2017. Each asset class is represented by a different color. For example, the white box shows cash returns; the light green b shows commodity returns; the dark blue box shows S&P 500 returns and so on. Recall that one of the implications of "no free lunch" is the risk vs. return trade-off, where higher r assets have higher expected returns and lower risk assets have lower expected returns. If this we hold true each year, one would expect returns of riskier assets to rank amongst highest each year returns less risky assets to rank amongst the lowest. The color pattern in the figure below is random. Meaning that in any given year, returns of less ris assets may or may not exceed that of higher risk assets. For example, in 2000, 2001 & 2008, US Treasury bonds & cash (less risky assets) had higher returns than that of the S&P 500 & MSCI-EAF (higher risk assets). Reconcile this phenomenon with the risk vs. return trade-off. Does this violate "no free lunch"? Explain. (20 pts) 2001 2000 2001 2014 2016 2002 2010 2013 2005 2006 2000 2004 2007 2001 2012 2011 4. The figure below was taken from a Module 3 ppt slide and shows the returns of various asset classes ranked from highest to lowest during each year from 2000 to 2017. Each asset class is represented by a different color. For example, the white box shows cash returns; the light green b shows commodity returns; the dark blue box shows S&P 500 returns and so on. Recall that one of the implications of "no free lunch" is the risk vs. return trade-off, where higher r assets have higher expected returns and lower risk assets have lower expected returns. If this we hold true each year, one would expect returns of riskier assets to rank amongst highest each year returns less risky assets to rank amongst the lowest. The color pattern in the figure below is random. Meaning that in any given year, returns of less ris assets may or may not exceed that of higher risk assets. For example, in 2000, 2001 & 2008, US Treasury bonds & cash (less risky assets) had higher returns than that of the S&P 500 & MSCI-EAF (higher risk assets). Reconcile this phenomenon with the risk vs. return trade-off. Does this violate "no free lunch"? Explain. (20 pts) 2001 2000 2001 2014 2016 2002 2010 2013 2005 2006 2000 2004 2007 2001 2012 2011
Step by Step Solution
There are 3 Steps involved in it

Get step-by-step solutions from verified subject matter experts