

Question: The figure is a history graph at ( x = 0 mathrm { ~m } ) of a wave moving to the
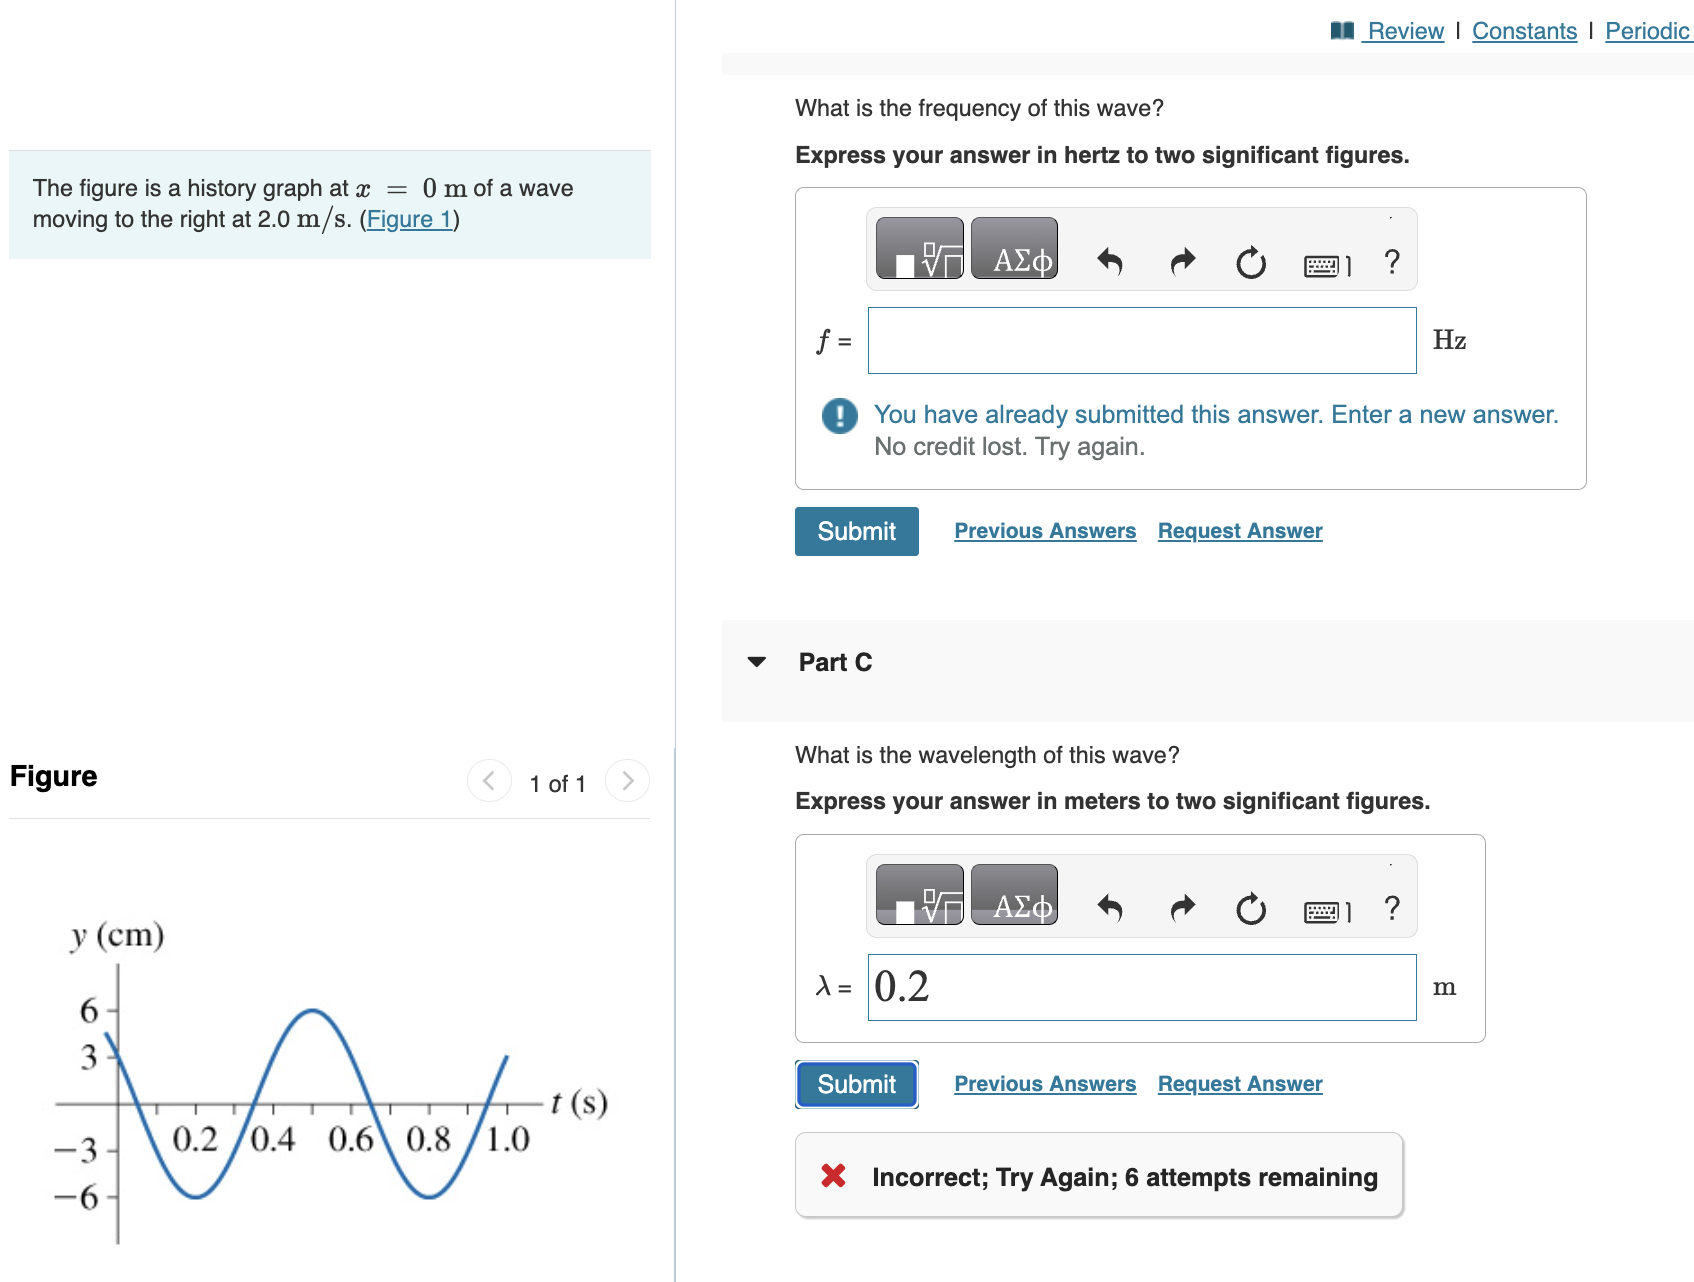
The figure is a history graph at xmathrm~m of a wave moving to the right at mathrm~mmathrmsFigure
What is the frequency of this wave?
Express your answer in hertz to two significant figures.
f
Hz
You have already submitted this answer. Enter a new answer. No credit lost. Try again.
Request Answer
Part C
What is the wavelength of this wave?
Express your answer in meters to two significant figures.
lambda
m
Incorrect; Try Again; attempts remaining
Step by Step Solution
There are 3 Steps involved in it
1 Expert Approved Answer
Step: 1 Unlock

Question Has Been Solved by an Expert!
Get step-by-step solutions from verified subject matter experts
Step: 2 Unlock
Step: 3 Unlock