

Question: The figure provided below is a plot of shear viscosity versus shear rate for a polyethylene melt at two temperatures Q) Determine the consistency index,
The figure provided below is a plot of shear viscosity versus shear rate for a polyethylene melt at two temperatures 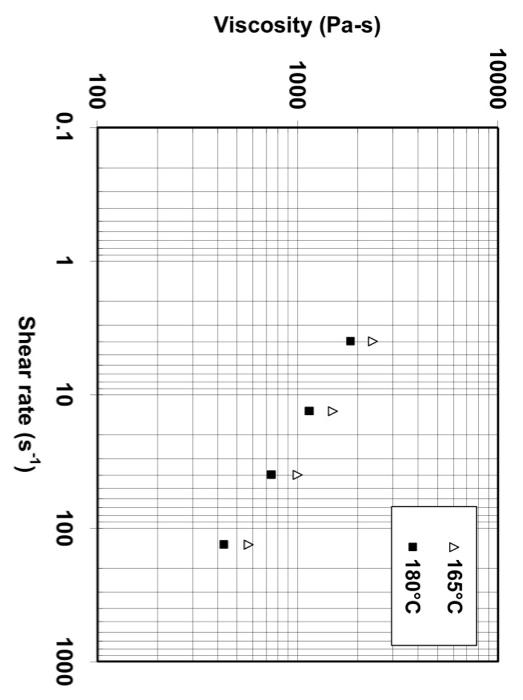
Q) Determine the consistency index, m and the power-law constant, n at both temperatures?
Step by Step Solution
There are 3 Steps involved in it
1 Expert Approved Answer
Step: 1 Unlock

Question Has Been Solved by an Expert!
Get step-by-step solutions from verified subject matter experts
Step: 2 Unlock
Step: 3 Unlock