

Question: The figure shown to the right contains a scatter plot of 1 0 data points for trees, where the diameter of a tree at breast
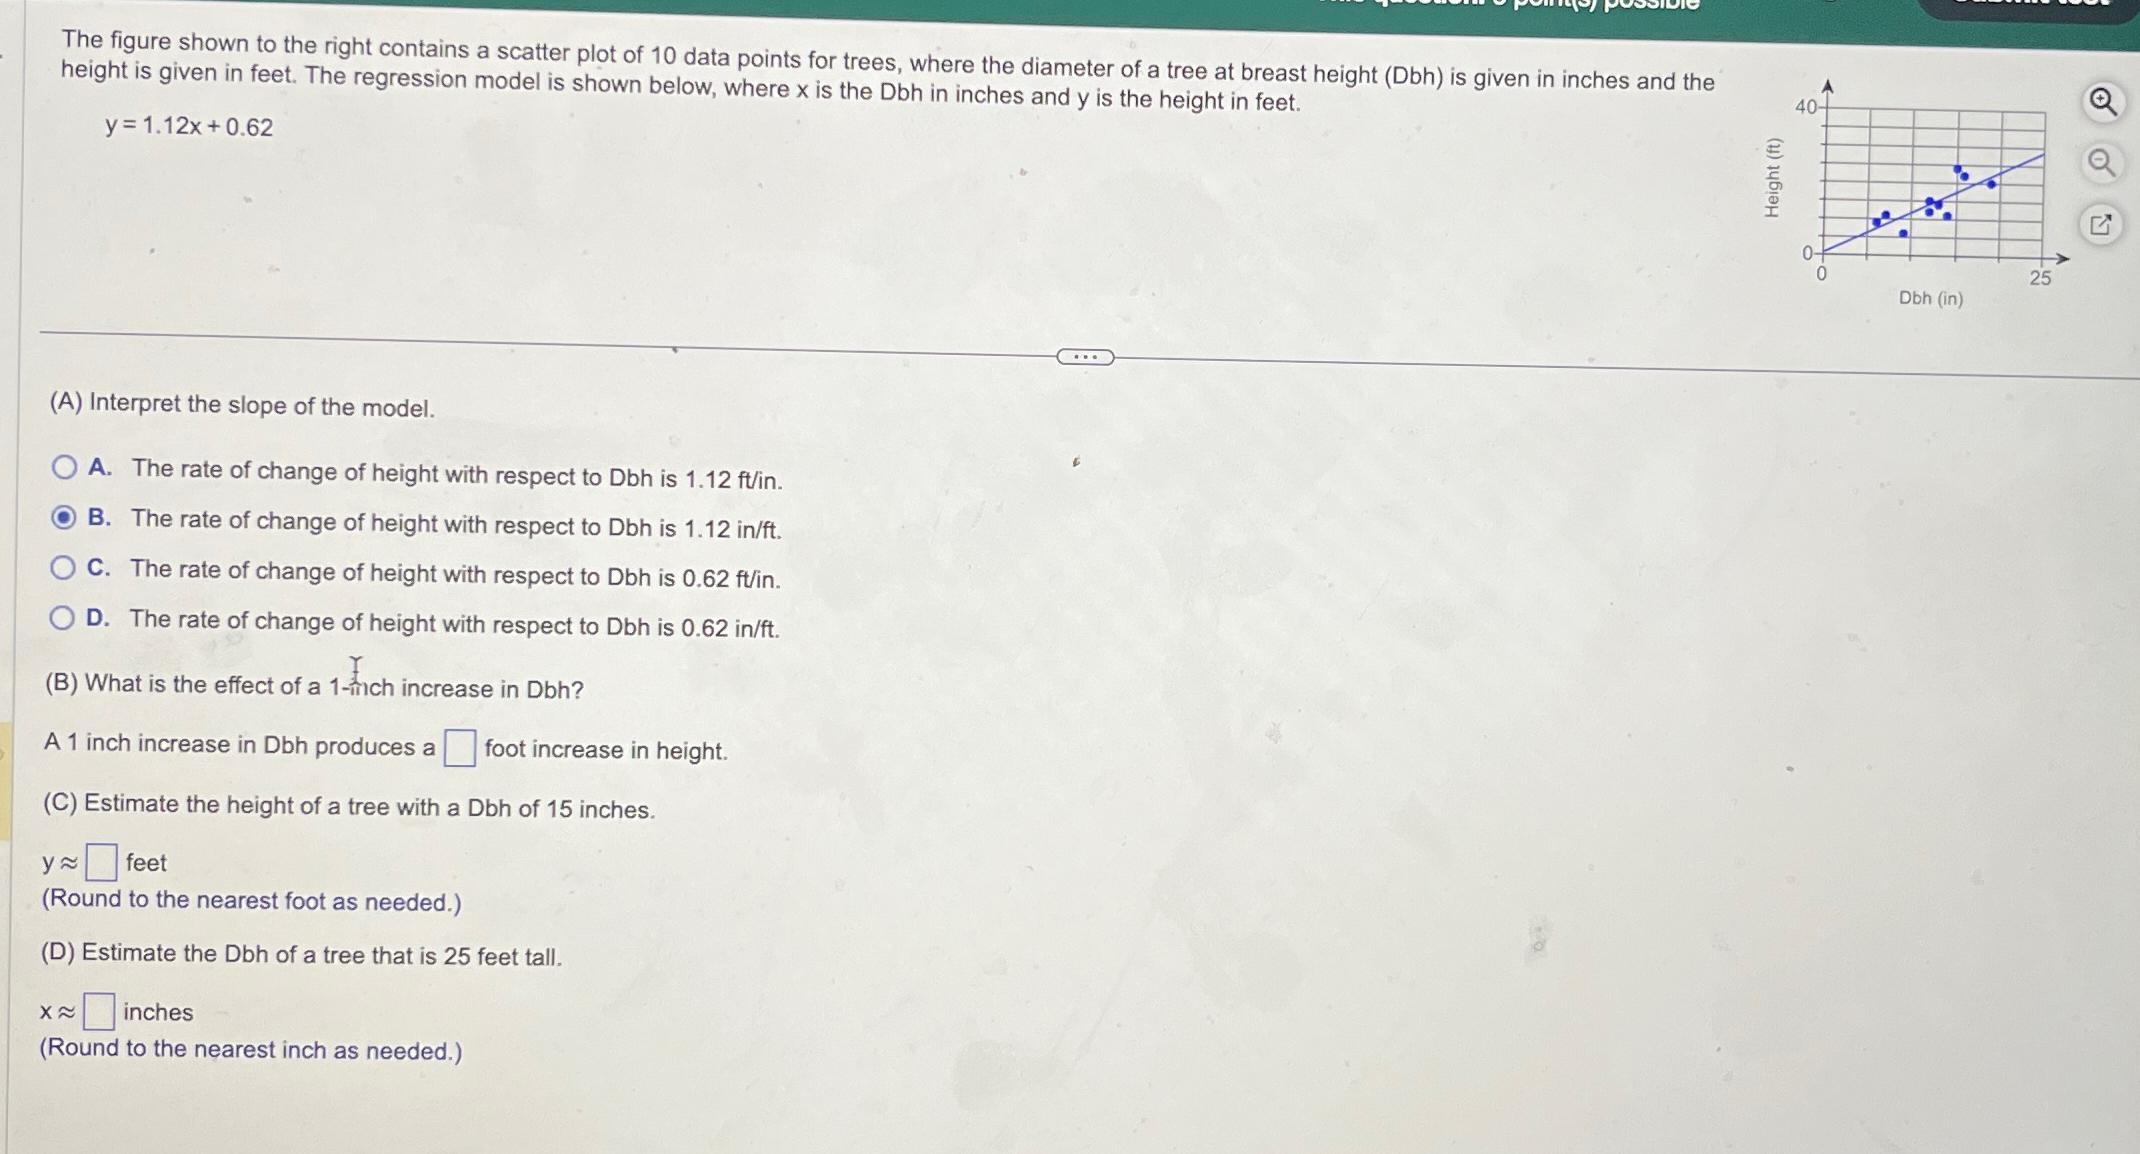
The figure shown to the right contains a scatter plot of data points for trees, where the diameter of a tree at breast height Dbh is given in inches and the height is given in feet. The regression model is shown below, where is the Dbh in inches and is the height in feet.
A Interpret the slope of the model.
A The rate of change of height with respect to is
B The rate of change of height with respect to is
C The rate of change of height with respect to Dbh is
D The rate of change of height with respect to is
B What is the effect of a Inch increase in Dbh
A inch increase in Dbh produces a foot increase in height.
C Estimate the height of a tree with a Dbh of inches.
~~ feet
Round to the nearest foot as needed.
D Estimate the Dbh of a tree that is feet tall.
~~ inches
Round to the nearest inch as needed.
Step by Step Solution
There are 3 Steps involved in it
1 Expert Approved Answer
Step: 1 Unlock

Question Has Been Solved by an Expert!
Get step-by-step solutions from verified subject matter experts
Step: 2 Unlock
Step: 3 Unlock