

The figure shows a liquid-vapor phase diagram for a mixture binary species 1 and 2 at 293
Fantastic news! We've Found the answer you've been seeking!
Question:
The figure shows a liquid-vapor phase diagram for a mixture binary species 1 and 2 at 293 K the following figure.
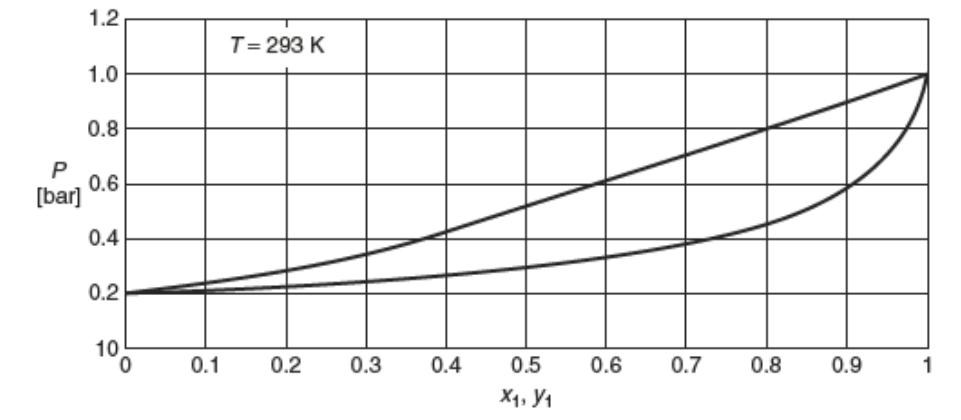
From these data:
a) Estimate the value of parameter “A” Márgules
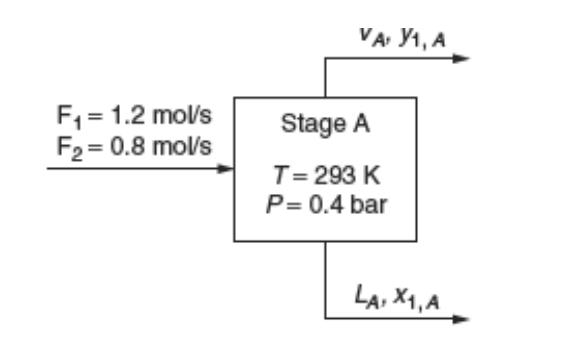
b) Consider the steady-state flash operation shown, determine the
flow of vapor (VA), liquid (LA) and their compositions. Consider a solution
real.
Expert Answer:

Related Book For 
Posted Date:
