

The figure shows how a function f(x) and its linear approximation (i.e., its tangent line) change value
Fantastic news! We've Found the answer you've been seeking!
Question:
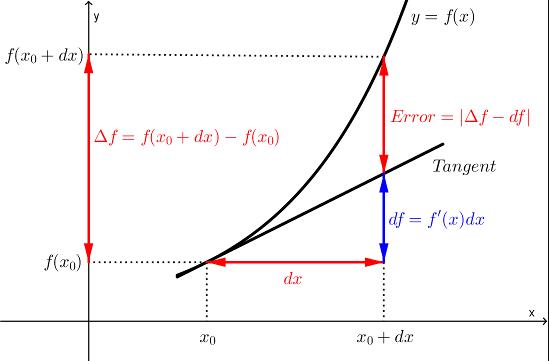
The figure shows how a function f(x) and its linear approximation (i.e., its tangent line) change value when x changes from x0 to x0+dx.
Suppose f(x)=x2+4x, x0=2 and dx=0.04. Your answers below need to be very precise, so use many decimal places.
(a) Find the change Δf=f(x0+dx)−f(x0)).
Δf =
(b) Find the estimate (i.e., the differential) df=f′(x0)dx.
df =
(c) Find the approximation error |Δf−df|
Error =
Expert Answer:

Related Book For 

Calculus Early Transcendentals
ISBN: 978-0321947345
2nd edition
Authors: William L. Briggs, Lyle Cochran, Bernard Gillett
Posted Date:
