

Question: The sample data below shows the first six banking data of the Excel file Banking Data, which provides data acquired from banking and census records
The sample data below shows the first six banking data of the Excel file Banking Data, which provides data acquired from banking and census records for different zip codes in the bank’s current market. Such information can be useful in targeting advertising or new customers or for choosing locations for branch offices. The data show the median age of the population, median years of education, median income, median home value, median household wealth, and average bank balance. If you run regression including all independent variables to predict the average bank balance of a customer, you will see that almost 94.7% of the variation in the average bank balance is explained by all five independent variables together, you can see that at a 0.05 level of significance, the p-values indicate that both Education, and Home Value do not appear to be significant. A good regression model should include only significant independent variables. However, it is not always clear exactly what will happen when add or remove variables from a model; variables that are (or are not) significant in one model may (or may not) be significant in another. Therefore, we should not consider dropping all insignificant variables at one time (do not do it), but rather take a more structured approach. This suggests a systematic approach to building good regression models:
1. Construct a model with all available independent variables. Check for significance of the independent variables by examining the p-values.
2. Identify the independent variable having the largest p-value that exceeds the chosen 0.05 level of significance.
3. Remove the variable identified in step 2 from the model and check for significance of the independent variables again. (Do not remove all variables with p-values that exceed at the same time, but remove only one at a time.)
4. Continue until all variables are significant, that is, until you find the best regression model.
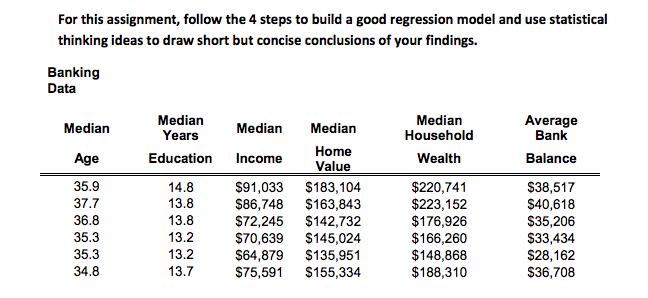
For this assignment, follow the 4 steps to build a good regression model and use statistical thinking ideas to draw short but concise conclusions of your findings. Banking Data Median Years Median Household Average Bank Median Median Median Age Home Value Education Income Wealth Balance 35.9 $220,741 $223,152 $176,926 $166,260 $148,868 $188,310 14.8 $91,033 $183,104 $163,843 $142,732 $145,024 $135,951 $155,334 $38,517 $40,618 37.7 13.8 $86,748 36.8 13.8 S72,245 $70,639 $64,879 $75,591 $35,206 $3,434 35.3 13.2 35.3 34.8 13.2 $28,162 13.7 $36,708
Step by Step Solution
3.53 Rating (187 Votes )
There are 3 Steps involved in it
To build a good regression model using the provided banking data lets follow the specified steps Ste... View full answer

Get step-by-step solutions from verified subject matter experts