

Question: The figures shown represent a visual pattern of tiles. 38 H H Figure 1 Figure 2 Figure 3 Create a table to display the
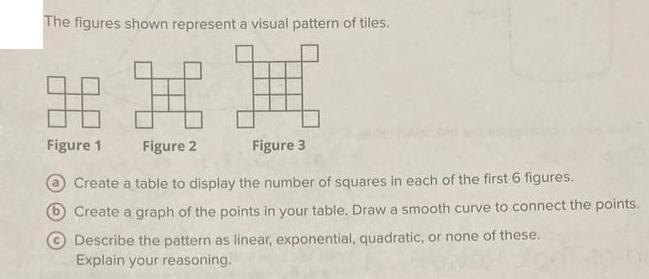
The figures shown represent a visual pattern of tiles. 38 H H Figure 1 Figure 2 Figure 3 Create a table to display the number of squares in each of the first 6 figures. b Create a graph of the points in your table. Draw a smooth curve to connect the points. Describe the pattern as linear, exponential, quadratic, or none of these. Explain your reasoning.
Step by Step Solution
★★★★★
3.38 Rating (145 Votes )
There are 3 Steps involved in it
1 Expert Approved Answer
Step: 1 Unlock

Question Has Been Solved by an Expert!
Get step-by-step solutions from verified subject matter experts
Step: 2 Unlock
Step: 3 Unlock