

Question: The file P 0 3 _ 4 4 . xIsx contains daily values of the S&P Index from 1 9 7 0 to mid -
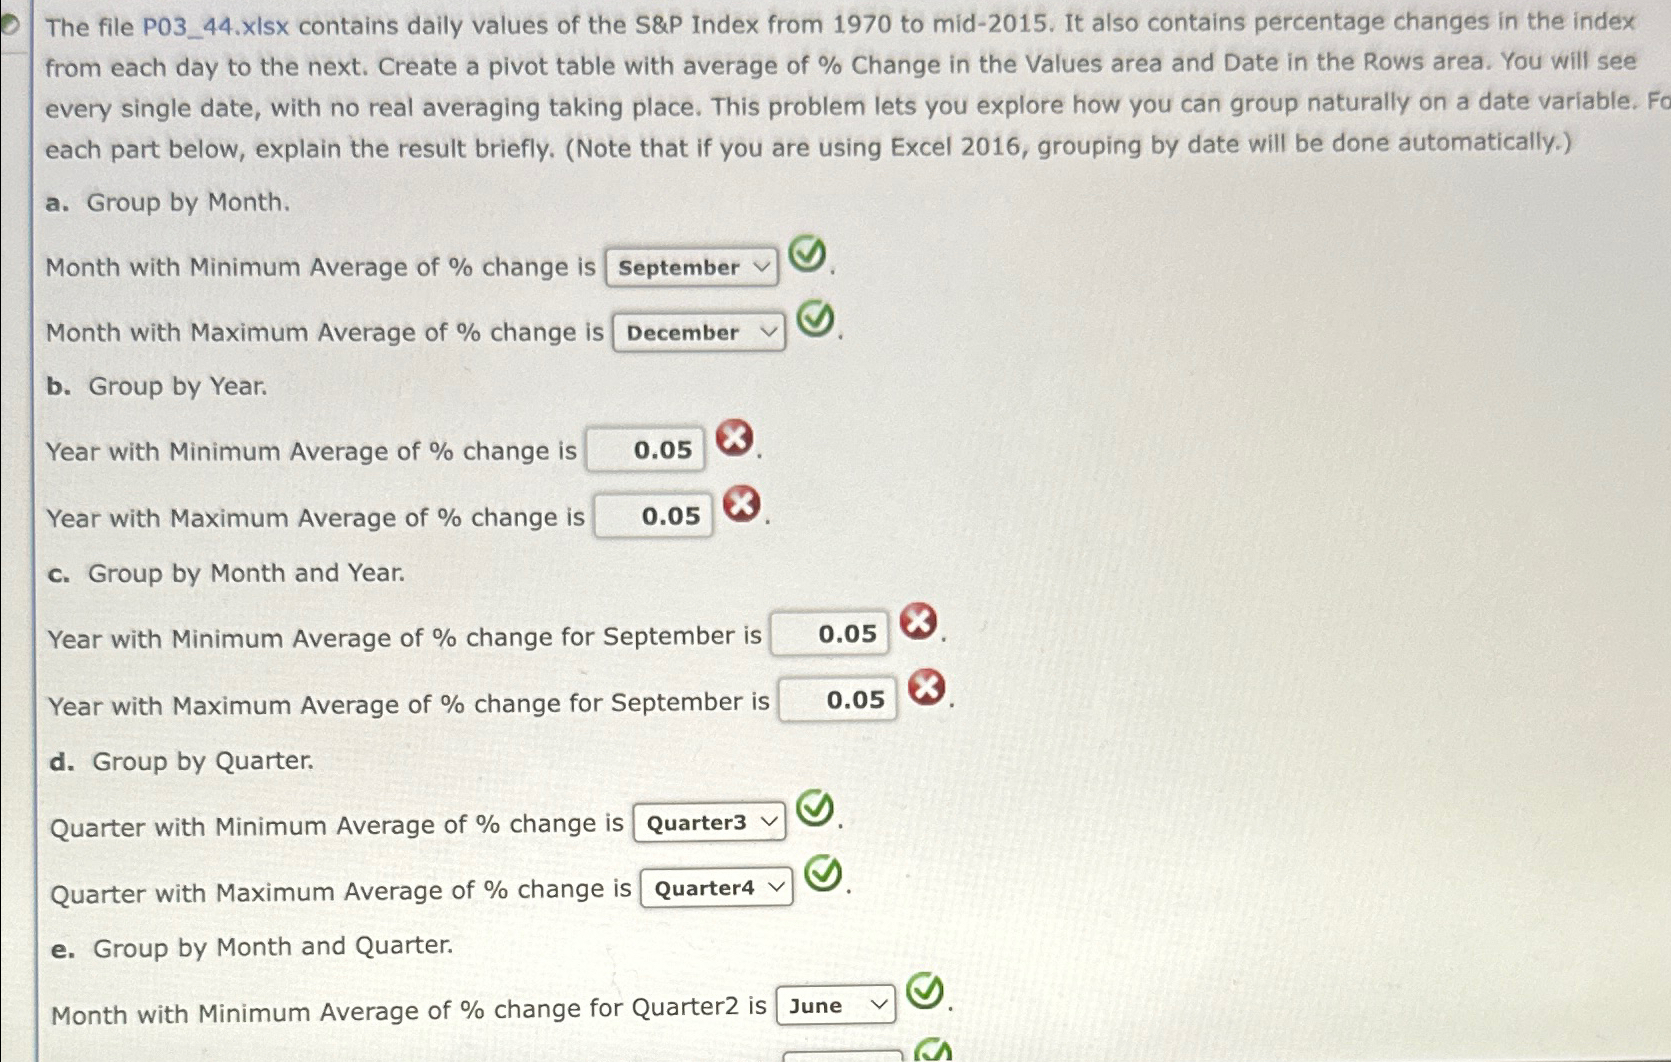
The file PxIsx contains daily values of the S&P Index from to mid It also contains percentage changes in the index from each day to the next. Create a pivot table with average of Change in the Values area and Date in the Rows area. You will see every single date, with no real averaging taking place. This problem lets you explore how you can group naturally on a date variable. Fo each part below, explain the result briefly. Note that if you are using Excel grouping by date will be done automatically.
a Group by Month.
Month with Minimum Average of change is
Month with Maximum Average of change is
b Group by Year.
Year with Minimum Average of change is
Year with Maximum Average of change is
c Group by Month and Year.
Year with Minimum Average of change for September is
Year with Maximum Average of change for September is
d Group by Quarter.
Quarter with Minimum Average of change is
Quarter with Maximum Average of change is
e Group by Month and Quarter.
Month with Minimum Average of change for Quarter is
Step by Step Solution
There are 3 Steps involved in it
1 Expert Approved Answer
Step: 1 Unlock

Question Has Been Solved by an Expert!
Get step-by-step solutions from verified subject matter experts
Step: 2 Unlock
Step: 3 Unlock