

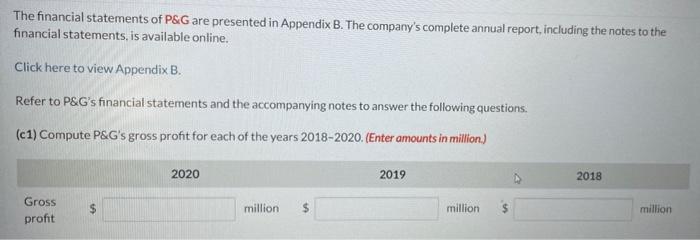
The financial statements of P&G are presented in Appendix B. The company's complete annual report, including...
Fantastic news! We've Found the answer you've been seeking!
Question:
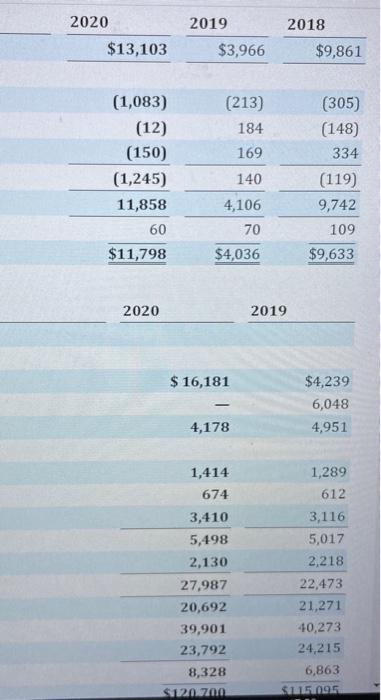
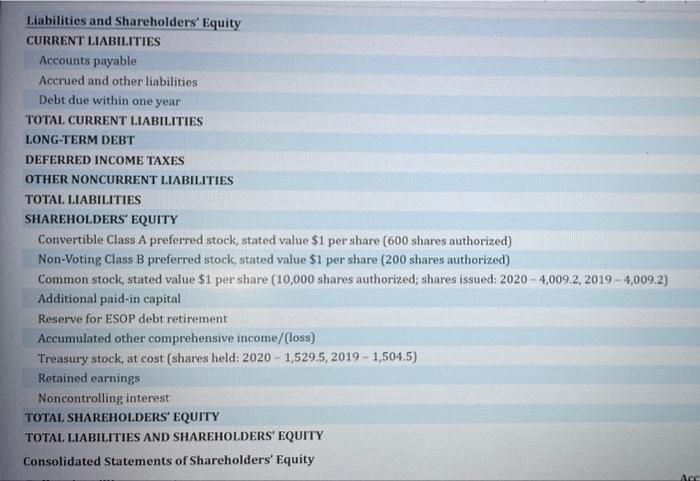
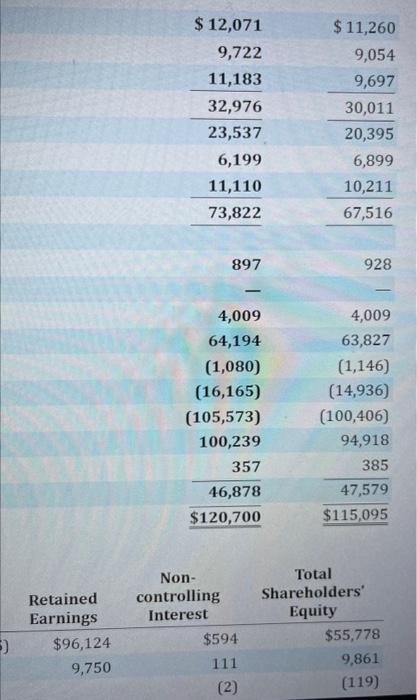
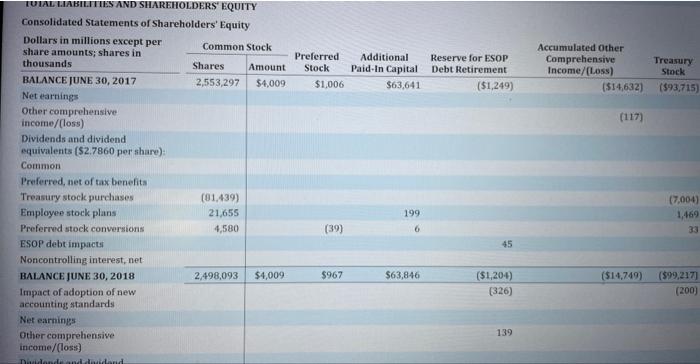
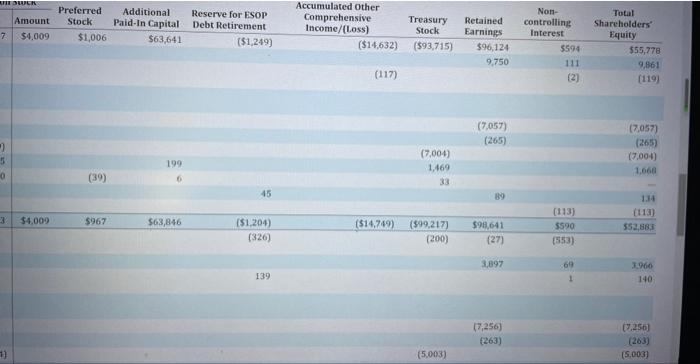
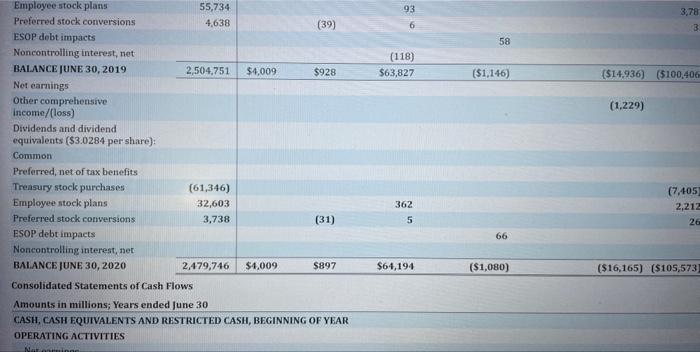
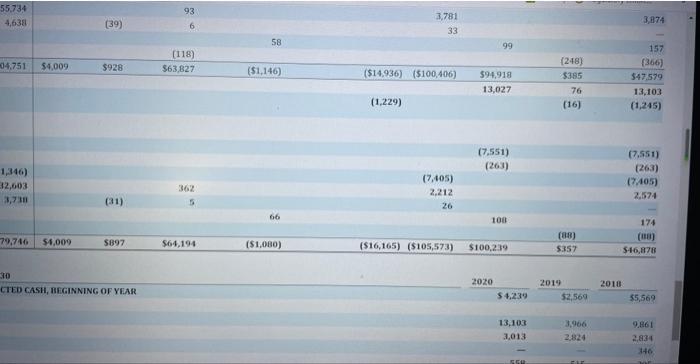
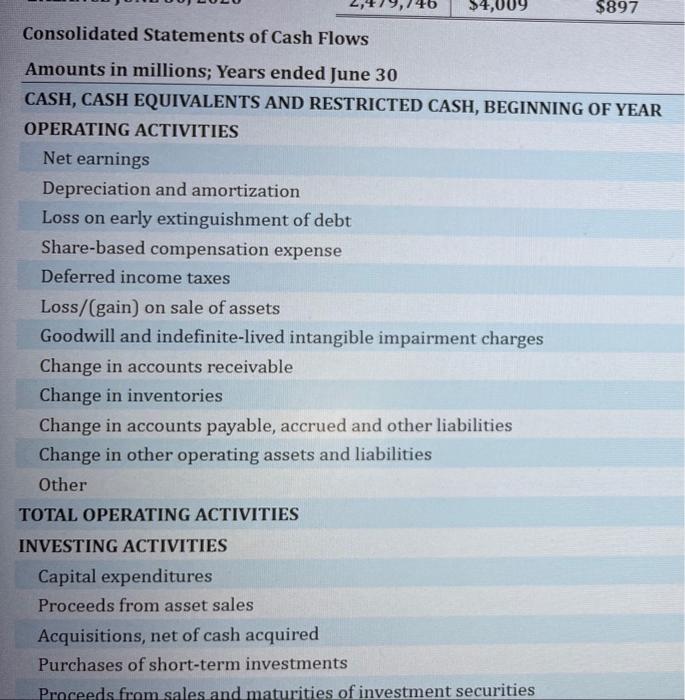
Transcribed Image Text:
The financial statements of P&G are presented in Appendix B. The company's complete annual report, including the notes to the financial statements, is available online. Click here to view Appendix B. Refer to P&G's financial statements and the accompanying notes to answer the following questions. (c1) Compute P&G's gross profit for each of the years 2018-2020. (Enter amounts in million) Gross profit $ 2020 million 2019 million 2018 million Consolidated Statements of Earnings Amounts in millions except per share amounts; Years ended June 30 NET SALES Cost of products sold Selling, general and administrative expense Goodwill and indefinite-lived intangibles impairment charges OPERATING INCOME Interest expense Interest income Other non-operating income, net EARNINGS BEFORE INCOME TAXES Income taxes NET EARNINGS Less: Net earnings attributable to noncontrolling interests NET EARNINGS ATTRIBUTABLE TO PROCTER & GAMBLE¹ NET EARNINGS PER COMMON SHARE:² Basic Diluted 2020 $70,950 35,250 19,994 15,706 (465) 155 438 15,834 2,731 13,103 76 $13,027 $5.13 $4.96 2019 2020 $67,684 34,768 19,084 8,345 Gillette indefinite-lived intangible assets. 5,487 (509) 220 871 6,069 2,103 3,966 69 $3,897 $1.45 $1.43 $13,103 (1,083) (12) 2019 $3,966 (213) 184 2018 $66,832 34,432 19,037 13,363 (506) 247 222 13,326 3,465 9,861 111 9,750 $ 3.75 $3.67 2018 $9,861 (305) (148) Amounts in millions; Years ended June 30 NET EARNINGS Accounts receivable INVENTORIES Comprehensive Income OTHER COMPREHENSIVE INCOME/(LOSS), NET OF TAX Foreign currency translation (net of $59, $78 and $(279) tax, respectively) Unrealized gains/(losses) on investment securities (net of $(1), $0 and $0 tax, respectively) Unrealized gains/(losses) on defined benefit retirement plans (net of $(42), $22 and $68 tax, respectively) TOTAL OTHER COMPREHENSIVE INCOME/(LOSS), NET OF TAX TOTAL COMPREHENSIVE INCOME Less: Total comprehensive income attributable to noncontrolling interests TOTAL COMPREHENSIVE INCOME ATTRIBUTABLE TO PROCTER & GAMBLE Consolidated Balance Sheets Amounts in millions except stated values; As of June 30 Assets CURRENT ASSETS Cash and cash equivalents Available-for-sale investment securities Materials and supplies Work in process Finished goods uutav Total inventories Prepaid expenses and other current assets TOTAL CURRENT ASSETS PROPERTY DLANT AND EQUIPMENT NET 2020 $13,103 (1,083) (12) (150) (1,245) 11,858 60 $11,798 2020 2019 $3,966 (213) 184 169 140 4,106 70 $4,036 $ 16,181 - 4,178 1,414 674 3,410 5,498 2,130 27,987 20,692 39,901 23,792 8,328 $120.700 2019 2018 $9,861 (305) (148) 334 (119) 9,742 109 $9,633 $4,239 6,048 4,951 1,289 612 3,116 5,017 2,218 22,473 21,271 40,273 24,215 6,863 SL15095 Liabilities and Shareholders' Equity CURRENT LIABILITIES Accounts payable Accrued and other liabilities Debt due within one year TOTAL CURRENT LIABILITIES LONG-TERM DEBT DEFERRED INCOME TAXES OTHER NONCURRENT LIABILITIES TOTAL LIABILITIES SHAREHOLDERS' EQUITY Convertible Class A preferred stock, stated value $1 per share (600 shares authorized) Non-Voting Class B preferred stock, stated value $1 per share (200 shares authorized) Common stock, stated value $1 per share (10,000 shares authorized; shares issued: 2020-4,009.2, 2019-4,009.2) Additional paid-in capital Reserve for ESOP debt retirement Accumulated other comprehensive income/(loss) Treasury stock, at cost (shares held: 2020- 1,529.5, 2019 - 1,504.5) Retained earnings Noncontrolling interest TOTAL SHAREHOLDERS' EQUITY TOTAL LIABILITIES AND SHAREHOLDERS' EQUITY Consolidated Statements of Shareholders' Equity Acc 5) Retained Earnings $96,124 9,750 $ 12,071 9,722 11,183 32,976 23,537 6,199 11,110 73,822 897 4,009 64,194 (1,080) (16,165) (105,573) 100,239 Non- controlling Interest - 357 46,878 $120,700 $594 111 (2) $11,260 9,054 9,697 30,011 20,395 6,899 10,211 67,516 928 4,009 63,827 (1,146) (14,936) (100,406) 94,918 385 47,579 $115,095 Total Shareholders' Equity $55,778 9,861 (119) TOTAL LIABILITIES AND SHAREHOLDERS' EQUITY Consolidated Statements of Shareholders' Equity Dollars in millions except per share amounts; shares in thousands BALANCE JUNE 30, 2017 Net earnings Other comprehensive income/(loss) Dividends and dividend equivalents ($2.7860 per share): Common Preferred, net of tax benefits Treasury stock purchases Employee stock plans Preferred stock conversions ESOP debt impacts Noncontrolling interest, net. BALANCE JUNE 30, 2018 Impact of adoption of new accounting standards Net earnings Other comprehensive income/(loss) Dagdonde and decidand Common Stock Amount Shares 2,553,297 $4,009 (81,439) 21,655 4,580 2,498,093 $4,009 Preferred Stock $1,006 (39) $967 Additional Paid-In Capital $63,641 199 6 $63,846 Reserve for ESOP Debt Retirement ($1,249) 45 ($1,204) (326) 139 Accumulated Other Comprehensive Income/(Loss) Treasury Stock ($14,632) ($93,715) (117) ($14,749) (7,004) 1,469 33 ($99,217) (200) ANSWER 7 2 5 0 3 $4,009 4) Preferred Additional Reserve for ESOP Debt Retirement ($1,249) Amount Stock $4,009 $1,006 (39) $967 Paid-In Capital $63,641 199 6 $63,846 45 ($1,204) (326) 139 Accumulated Other Comprehensive Income/(Loss) Treasury Retained Stock Earnings ($14,632) ($93,715) $96,124 9,750 (117) ($14,749) (7,004) 1,469 33 ($99,217) (200) (5,003) (7,057) (265) 89 $98,641 (27) 3,897 (7,256) (263) Non- controlling Interest $594 111 (2) (113) $590 (553) 69 1 Total Shareholders' Equity $55,778 9,861 (119) (7,057) (265) (7,004) 1,668 134 $52,883 3,966 140 (7.256) (263) (5,003) Employee stock plans Preferred stock conversions ESOP debt impacts Noncontrolling interest, net BALANCE JUNE 30, 2019 Net earnings Other comprehensive income/(loss) Dividends and dividend equivalents ($3.0284 per share): Common Preferred, net of tax benefits Treasury stock purchases Employee stock plans Preferred stock conversions ESOP debt impacts Noncontrolling interest, net BALANCE JUNE 30, 2020 55,734 4,638 2,504,751 $4,009 (61,346) 32,603 3,738 2,479,746 $4,009 (39) $928 (31) $897 Consolidated Statements of Cash Flows Amounts in millions; Years ended June 30 CASH, CASH EQUIVALENTS AND RESTRICTED CASH, BEGINNING OF YEAR OPERATING ACTIVITIES Nat 93 6 (118) $63,827 362 5 $64,194 58 ($1,146) 66 ($1,080) 3,78 (1,229) 3 ($14,936) ($100,406 (7,405) 2,212 26 ($16,165) ($105,573) 55,734 4,638 04.751 $4,009 1,346) 32,603 3,738 79,746 $4,009 (39) $928 (31) $897 30 CTED CASH, BEGINNING OF YEAR 93 6 (118) $63,827 5 $64,194 58 ($1,146) 66 ($1,080) 3,781 33 (1,229) ($14,936) ($100,406) $94,918 13,027 (7,405) 2,212 26 ($16,165) ($105,573) 66 (7,551) (263) 108 $100,239 2020 $4,239 13,103 3,013 LEER (248) $385 76 (16) (88) $357 2019 $2,569 3,966 2,824 THE 2018 3,874 157 (366) $47,579 13,103 (1,245) (7,551) (263) (7,405) 2,574 174 (8) $46,878 $5,569 9,861 2,834 346 Jor Net earnings Depreciation and amortization Loss on early extinguishment of debt Share-based compensation expense Deferred income taxes $4,009 Consolidated Statements of Cash Flows Amounts in millions; Years ended June 30 CASH, CASH EQUIVALENTS AND RESTRICTED CASH, BEGINNING OF YEAR OPERATING ACTIVITIES Loss/(gain) on sale of assets Goodwill and indefinite-lived intangible impairment charges Change in accounts receivable Change in inventories Change in accounts payable, accrued and other liabilities Change in other operating assets and liabilities Other TOTAL OPERATING ACTIVITIES INVESTING ACTIVITIES Capital expenditures Proceeds from asset sales $897 Acquisitions, net of cash acquired Purchases of short-term investments Proceeds from sales and maturities of investment securities 2020 $ 4,239 13,103 3,013 - 558 (596) 7 - 634 (637) 1,923 (710) 108 17,403 (3,073) 30 (58) 6,151 (5) 3,045 ܝܝ (7,789) 2019 $2,569 3,966 2,824 515 (411) (678) 8,345 (276) (239) 1,856 (973) 313 15,242 (3,347) 394 (3,945) (158) 3,628 (62) (3,490) (7,498) ܘܘ 2018 $5,569 9,861 2,834 346 395 (1,844) (176) (177) (188) 1,385 2,000 431 14,867 (3,717) 269 (109) (3,909) 3,928 27 (3,511) (7,310) Other TOTAL OPERATING ACTIVITIES INVESTING ACTIVITIES Capital expenditures Proceeds from asset sales Acquisitions, net of cash acquired Purchases of short-term investments Proceeds from sales and maturities of investment securities Change in other investments TOTAL INVESTING ACTIVITIES FINANCING ACTIVITIES Dividends to shareholders i Increases/(reductions) in short-term debt Additions to long-term debt Reductions of long-term debt Treasury stock purchases Impact of stock options and other TOTAL FINANCING ACTIVITIES EFFECT OF EXCHANGE RATE CHANGES ON CASH, CASH EQUIVALENTS AND RESTRICTED CASH CHANGE IN CASH, CASH EQUIVALENTS AND RESTRICTED CASH CASH, CASH EQUIVALENTS AND RESTRICTED CASH, END OF YEAR SUPPLEMENTAL DISCLOSURE Cash payments for interest Cash payment for income taxes Assets acquired through non-cash finance leases are immaterial for all periods. Includes early outingui (710) 108 17,403 (3,073) 30 (58) - 6,151 (5) 3,045 (7,789) 2,345 4,951 (2,447) (7,405) 1,978 (8,367) (139) 11,942 $16,181 $434 3,550 (973) 313 15,242 (3,347) 394 (3,945) (158) 3,628 (62) (3,490) (7,498) (2,215) 2,367 (969) (5,003) 3,324 (9,994) (88) 1,670 $4,239 $497 3,064 2,000 431 14,867 (3,717) 269 (109) (3,909) 3,928 27 (3,511) (7,310) (3,437) 5,072 (2,873) (7,004) 1,177 (14,375) 19 (3,000) $ 2,569 $529 2,830 The financial statements of P&G are presented in Appendix B. The company's complete annual report, including the notes to the financial statements, is available online. Click here to view Appendix B. Refer to P&G's financial statements and the accompanying notes to answer the following questions. (c1) Compute P&G's gross profit for each of the years 2018-2020. (Enter amounts in million) Gross profit $ 2020 million 2019 million 2018 million Consolidated Statements of Earnings Amounts in millions except per share amounts; Years ended June 30 NET SALES Cost of products sold Selling, general and administrative expense Goodwill and indefinite-lived intangibles impairment charges OPERATING INCOME Interest expense Interest income Other non-operating income, net EARNINGS BEFORE INCOME TAXES Income taxes NET EARNINGS Less: Net earnings attributable to noncontrolling interests NET EARNINGS ATTRIBUTABLE TO PROCTER & GAMBLE¹ NET EARNINGS PER COMMON SHARE:² Basic Diluted 2020 $70,950 35,250 19,994 15,706 (465) 155 438 15,834 2,731 13,103 76 $13,027 $5.13 $4.96 2019 2020 $67,684 34,768 19,084 8,345 Gillette indefinite-lived intangible assets. 5,487 (509) 220 871 6,069 2,103 3,966 69 $3,897 $1.45 $1.43 $13,103 (1,083) (12) 2019 $3,966 (213) 184 2018 $66,832 34,432 19,037 13,363 (506) 247 222 13,326 3,465 9,861 111 9,750 $ 3.75 $3.67 2018 $9,861 (305) (148) Amounts in millions; Years ended June 30 NET EARNINGS Accounts receivable INVENTORIES Comprehensive Income OTHER COMPREHENSIVE INCOME/(LOSS), NET OF TAX Foreign currency translation (net of $59, $78 and $(279) tax, respectively) Unrealized gains/(losses) on investment securities (net of $(1), $0 and $0 tax, respectively) Unrealized gains/(losses) on defined benefit retirement plans (net of $(42), $22 and $68 tax, respectively) TOTAL OTHER COMPREHENSIVE INCOME/(LOSS), NET OF TAX TOTAL COMPREHENSIVE INCOME Less: Total comprehensive income attributable to noncontrolling interests TOTAL COMPREHENSIVE INCOME ATTRIBUTABLE TO PROCTER & GAMBLE Consolidated Balance Sheets Amounts in millions except stated values; As of June 30 Assets CURRENT ASSETS Cash and cash equivalents Available-for-sale investment securities Materials and supplies Work in process Finished goods uutav Total inventories Prepaid expenses and other current assets TOTAL CURRENT ASSETS PROPERTY DLANT AND EQUIPMENT NET 2020 $13,103 (1,083) (12) (150) (1,245) 11,858 60 $11,798 2020 2019 $3,966 (213) 184 169 140 4,106 70 $4,036 $ 16,181 - 4,178 1,414 674 3,410 5,498 2,130 27,987 20,692 39,901 23,792 8,328 $120.700 2019 2018 $9,861 (305) (148) 334 (119) 9,742 109 $9,633 $4,239 6,048 4,951 1,289 612 3,116 5,017 2,218 22,473 21,271 40,273 24,215 6,863 SL15095 Liabilities and Shareholders' Equity CURRENT LIABILITIES Accounts payable Accrued and other liabilities Debt due within one year TOTAL CURRENT LIABILITIES LONG-TERM DEBT DEFERRED INCOME TAXES OTHER NONCURRENT LIABILITIES TOTAL LIABILITIES SHAREHOLDERS' EQUITY Convertible Class A preferred stock, stated value $1 per share (600 shares authorized) Non-Voting Class B preferred stock, stated value $1 per share (200 shares authorized) Common stock, stated value $1 per share (10,000 shares authorized; shares issued: 2020-4,009.2, 2019-4,009.2) Additional paid-in capital Reserve for ESOP debt retirement Accumulated other comprehensive income/(loss) Treasury stock, at cost (shares held: 2020- 1,529.5, 2019 - 1,504.5) Retained earnings Noncontrolling interest TOTAL SHAREHOLDERS' EQUITY TOTAL LIABILITIES AND SHAREHOLDERS' EQUITY Consolidated Statements of Shareholders' Equity Acc 5) Retained Earnings $96,124 9,750 $ 12,071 9,722 11,183 32,976 23,537 6,199 11,110 73,822 897 4,009 64,194 (1,080) (16,165) (105,573) 100,239 Non- controlling Interest - 357 46,878 $120,700 $594 111 (2) $11,260 9,054 9,697 30,011 20,395 6,899 10,211 67,516 928 4,009 63,827 (1,146) (14,936) (100,406) 94,918 385 47,579 $115,095 Total Shareholders' Equity $55,778 9,861 (119) TOTAL LIABILITIES AND SHAREHOLDERS' EQUITY Consolidated Statements of Shareholders' Equity Dollars in millions except per share amounts; shares in thousands BALANCE JUNE 30, 2017 Net earnings Other comprehensive income/(loss) Dividends and dividend equivalents ($2.7860 per share): Common Preferred, net of tax benefits Treasury stock purchases Employee stock plans Preferred stock conversions ESOP debt impacts Noncontrolling interest, net. BALANCE JUNE 30, 2018 Impact of adoption of new accounting standards Net earnings Other comprehensive income/(loss) Dagdonde and decidand Common Stock Amount Shares 2,553,297 $4,009 (81,439) 21,655 4,580 2,498,093 $4,009 Preferred Stock $1,006 (39) $967 Additional Paid-In Capital $63,641 199 6 $63,846 Reserve for ESOP Debt Retirement ($1,249) 45 ($1,204) (326) 139 Accumulated Other Comprehensive Income/(Loss) Treasury Stock ($14,632) ($93,715) (117) ($14,749) (7,004) 1,469 33 ($99,217) (200) ANSWER 7 2 5 0 3 $4,009 4) Preferred Additional Reserve for ESOP Debt Retirement ($1,249) Amount Stock $4,009 $1,006 (39) $967 Paid-In Capital $63,641 199 6 $63,846 45 ($1,204) (326) 139 Accumulated Other Comprehensive Income/(Loss) Treasury Retained Stock Earnings ($14,632) ($93,715) $96,124 9,750 (117) ($14,749) (7,004) 1,469 33 ($99,217) (200) (5,003) (7,057) (265) 89 $98,641 (27) 3,897 (7,256) (263) Non- controlling Interest $594 111 (2) (113) $590 (553) 69 1 Total Shareholders' Equity $55,778 9,861 (119) (7,057) (265) (7,004) 1,668 134 $52,883 3,966 140 (7.256) (263) (5,003) Employee stock plans Preferred stock conversions ESOP debt impacts Noncontrolling interest, net BALANCE JUNE 30, 2019 Net earnings Other comprehensive income/(loss) Dividends and dividend equivalents ($3.0284 per share): Common Preferred, net of tax benefits Treasury stock purchases Employee stock plans Preferred stock conversions ESOP debt impacts Noncontrolling interest, net BALANCE JUNE 30, 2020 55,734 4,638 2,504,751 $4,009 (61,346) 32,603 3,738 2,479,746 $4,009 (39) $928 (31) $897 Consolidated Statements of Cash Flows Amounts in millions; Years ended June 30 CASH, CASH EQUIVALENTS AND RESTRICTED CASH, BEGINNING OF YEAR OPERATING ACTIVITIES Nat 93 6 (118) $63,827 362 5 $64,194 58 ($1,146) 66 ($1,080) 3,78 (1,229) 3 ($14,936) ($100,406 (7,405) 2,212 26 ($16,165) ($105,573) 55,734 4,638 04.751 $4,009 1,346) 32,603 3,738 79,746 $4,009 (39) $928 (31) $897 30 CTED CASH, BEGINNING OF YEAR 93 6 (118) $63,827 5 $64,194 58 ($1,146) 66 ($1,080) 3,781 33 (1,229) ($14,936) ($100,406) $94,918 13,027 (7,405) 2,212 26 ($16,165) ($105,573) 66 (7,551) (263) 108 $100,239 2020 $4,239 13,103 3,013 LEER (248) $385 76 (16) (88) $357 2019 $2,569 3,966 2,824 THE 2018 3,874 157 (366) $47,579 13,103 (1,245) (7,551) (263) (7,405) 2,574 174 (8) $46,878 $5,569 9,861 2,834 346 Jor Net earnings Depreciation and amortization Loss on early extinguishment of debt Share-based compensation expense Deferred income taxes $4,009 Consolidated Statements of Cash Flows Amounts in millions; Years ended June 30 CASH, CASH EQUIVALENTS AND RESTRICTED CASH, BEGINNING OF YEAR OPERATING ACTIVITIES Loss/(gain) on sale of assets Goodwill and indefinite-lived intangible impairment charges Change in accounts receivable Change in inventories Change in accounts payable, accrued and other liabilities Change in other operating assets and liabilities Other TOTAL OPERATING ACTIVITIES INVESTING ACTIVITIES Capital expenditures Proceeds from asset sales $897 Acquisitions, net of cash acquired Purchases of short-term investments Proceeds from sales and maturities of investment securities 2020 $ 4,239 13,103 3,013 - 558 (596) 7 - 634 (637) 1,923 (710) 108 17,403 (3,073) 30 (58) 6,151 (5) 3,045 ܝܝ (7,789) 2019 $2,569 3,966 2,824 515 (411) (678) 8,345 (276) (239) 1,856 (973) 313 15,242 (3,347) 394 (3,945) (158) 3,628 (62) (3,490) (7,498) ܘܘ 2018 $5,569 9,861 2,834 346 395 (1,844) (176) (177) (188) 1,385 2,000 431 14,867 (3,717) 269 (109) (3,909) 3,928 27 (3,511) (7,310) Other TOTAL OPERATING ACTIVITIES INVESTING ACTIVITIES Capital expenditures Proceeds from asset sales Acquisitions, net of cash acquired Purchases of short-term investments Proceeds from sales and maturities of investment securities Change in other investments TOTAL INVESTING ACTIVITIES FINANCING ACTIVITIES Dividends to shareholders i Increases/(reductions) in short-term debt Additions to long-term debt Reductions of long-term debt Treasury stock purchases Impact of stock options and other TOTAL FINANCING ACTIVITIES EFFECT OF EXCHANGE RATE CHANGES ON CASH, CASH EQUIVALENTS AND RESTRICTED CASH CHANGE IN CASH, CASH EQUIVALENTS AND RESTRICTED CASH CASH, CASH EQUIVALENTS AND RESTRICTED CASH, END OF YEAR SUPPLEMENTAL DISCLOSURE Cash payments for interest Cash payment for income taxes Assets acquired through non-cash finance leases are immaterial for all periods. Includes early outingui (710) 108 17,403 (3,073) 30 (58) - 6,151 (5) 3,045 (7,789) 2,345 4,951 (2,447) (7,405) 1,978 (8,367) (139) 11,942 $16,181 $434 3,550 (973) 313 15,242 (3,347) 394 (3,945) (158) 3,628 (62) (3,490) (7,498) (2,215) 2,367 (969) (5,003) 3,324 (9,994) (88) 1,670 $4,239 $497 3,064 2,000 431 14,867 (3,717) 269 (109) (3,909) 3,928 27 (3,511) (7,310) (3,437) 5,072 (2,873) (7,004) 1,177 (14,375) 19 (3,000) $ 2,569 $529 2,830 The financial statements of P&G are presented in Appendix B. The company's complete annual report, including the notes to the financial statements, is available online. Click here to view Appendix B. Refer to P&G's financial statements and the accompanying notes to answer the following questions. (c1) Compute P&G's gross profit for each of the years 2018-2020. (Enter amounts in million) Gross profit $ 2020 million 2019 million 2018 million Consolidated Statements of Earnings Amounts in millions except per share amounts; Years ended June 30 NET SALES Cost of products sold Selling, general and administrative expense Goodwill and indefinite-lived intangibles impairment charges OPERATING INCOME Interest expense Interest income Other non-operating income, net EARNINGS BEFORE INCOME TAXES Income taxes NET EARNINGS Less: Net earnings attributable to noncontrolling interests NET EARNINGS ATTRIBUTABLE TO PROCTER & GAMBLE¹ NET EARNINGS PER COMMON SHARE:² Basic Diluted 2020 $70,950 35,250 19,994 15,706 (465) 155 438 15,834 2,731 13,103 76 $13,027 $5.13 $4.96 2019 2020 $67,684 34,768 19,084 8,345 Gillette indefinite-lived intangible assets. 5,487 (509) 220 871 6,069 2,103 3,966 69 $3,897 $1.45 $1.43 $13,103 (1,083) (12) 2019 $3,966 (213) 184 2018 $66,832 34,432 19,037 13,363 (506) 247 222 13,326 3,465 9,861 111 9,750 $ 3.75 $3.67 2018 $9,861 (305) (148) Amounts in millions; Years ended June 30 NET EARNINGS Accounts receivable INVENTORIES Comprehensive Income OTHER COMPREHENSIVE INCOME/(LOSS), NET OF TAX Foreign currency translation (net of $59, $78 and $(279) tax, respectively) Unrealized gains/(losses) on investment securities (net of $(1), $0 and $0 tax, respectively) Unrealized gains/(losses) on defined benefit retirement plans (net of $(42), $22 and $68 tax, respectively) TOTAL OTHER COMPREHENSIVE INCOME/(LOSS), NET OF TAX TOTAL COMPREHENSIVE INCOME Less: Total comprehensive income attributable to noncontrolling interests TOTAL COMPREHENSIVE INCOME ATTRIBUTABLE TO PROCTER & GAMBLE Consolidated Balance Sheets Amounts in millions except stated values; As of June 30 Assets CURRENT ASSETS Cash and cash equivalents Available-for-sale investment securities Materials and supplies Work in process Finished goods uutav Total inventories Prepaid expenses and other current assets TOTAL CURRENT ASSETS PROPERTY DLANT AND EQUIPMENT NET 2020 $13,103 (1,083) (12) (150) (1,245) 11,858 60 $11,798 2020 2019 $3,966 (213) 184 169 140 4,106 70 $4,036 $ 16,181 - 4,178 1,414 674 3,410 5,498 2,130 27,987 20,692 39,901 23,792 8,328 $120.700 2019 2018 $9,861 (305) (148) 334 (119) 9,742 109 $9,633 $4,239 6,048 4,951 1,289 612 3,116 5,017 2,218 22,473 21,271 40,273 24,215 6,863 SL15095 Liabilities and Shareholders' Equity CURRENT LIABILITIES Accounts payable Accrued and other liabilities Debt due within one year TOTAL CURRENT LIABILITIES LONG-TERM DEBT DEFERRED INCOME TAXES OTHER NONCURRENT LIABILITIES TOTAL LIABILITIES SHAREHOLDERS' EQUITY Convertible Class A preferred stock, stated value $1 per share (600 shares authorized) Non-Voting Class B preferred stock, stated value $1 per share (200 shares authorized) Common stock, stated value $1 per share (10,000 shares authorized; shares issued: 2020-4,009.2, 2019-4,009.2) Additional paid-in capital Reserve for ESOP debt retirement Accumulated other comprehensive income/(loss) Treasury stock, at cost (shares held: 2020- 1,529.5, 2019 - 1,504.5) Retained earnings Noncontrolling interest TOTAL SHAREHOLDERS' EQUITY TOTAL LIABILITIES AND SHAREHOLDERS' EQUITY Consolidated Statements of Shareholders' Equity Acc 5) Retained Earnings $96,124 9,750 $ 12,071 9,722 11,183 32,976 23,537 6,199 11,110 73,822 897 4,009 64,194 (1,080) (16,165) (105,573) 100,239 Non- controlling Interest - 357 46,878 $120,700 $594 111 (2) $11,260 9,054 9,697 30,011 20,395 6,899 10,211 67,516 928 4,009 63,827 (1,146) (14,936) (100,406) 94,918 385 47,579 $115,095 Total Shareholders' Equity $55,778 9,861 (119) TOTAL LIABILITIES AND SHAREHOLDERS' EQUITY Consolidated Statements of Shareholders' Equity Dollars in millions except per share amounts; shares in thousands BALANCE JUNE 30, 2017 Net earnings Other comprehensive income/(loss) Dividends and dividend equivalents ($2.7860 per share): Common Preferred, net of tax benefits Treasury stock purchases Employee stock plans Preferred stock conversions ESOP debt impacts Noncontrolling interest, net. BALANCE JUNE 30, 2018 Impact of adoption of new accounting standards Net earnings Other comprehensive income/(loss) Dagdonde and decidand Common Stock Amount Shares 2,553,297 $4,009 (81,439) 21,655 4,580 2,498,093 $4,009 Preferred Stock $1,006 (39) $967 Additional Paid-In Capital $63,641 199 6 $63,846 Reserve for ESOP Debt Retirement ($1,249) 45 ($1,204) (326) 139 Accumulated Other Comprehensive Income/(Loss) Treasury Stock ($14,632) ($93,715) (117) ($14,749) (7,004) 1,469 33 ($99,217) (200) ANSWER 7 2 5 0 3 $4,009 4) Preferred Additional Reserve for ESOP Debt Retirement ($1,249) Amount Stock $4,009 $1,006 (39) $967 Paid-In Capital $63,641 199 6 $63,846 45 ($1,204) (326) 139 Accumulated Other Comprehensive Income/(Loss) Treasury Retained Stock Earnings ($14,632) ($93,715) $96,124 9,750 (117) ($14,749) (7,004) 1,469 33 ($99,217) (200) (5,003) (7,057) (265) 89 $98,641 (27) 3,897 (7,256) (263) Non- controlling Interest $594 111 (2) (113) $590 (553) 69 1 Total Shareholders' Equity $55,778 9,861 (119) (7,057) (265) (7,004) 1,668 134 $52,883 3,966 140 (7.256) (263) (5,003) Employee stock plans Preferred stock conversions ESOP debt impacts Noncontrolling interest, net BALANCE JUNE 30, 2019 Net earnings Other comprehensive income/(loss) Dividends and dividend equivalents ($3.0284 per share): Common Preferred, net of tax benefits Treasury stock purchases Employee stock plans Preferred stock conversions ESOP debt impacts Noncontrolling interest, net BALANCE JUNE 30, 2020 55,734 4,638 2,504,751 $4,009 (61,346) 32,603 3,738 2,479,746 $4,009 (39) $928 (31) $897 Consolidated Statements of Cash Flows Amounts in millions; Years ended June 30 CASH, CASH EQUIVALENTS AND RESTRICTED CASH, BEGINNING OF YEAR OPERATING ACTIVITIES Nat 93 6 (118) $63,827 362 5 $64,194 58 ($1,146) 66 ($1,080) 3,78 (1,229) 3 ($14,936) ($100,406 (7,405) 2,212 26 ($16,165) ($105,573) 55,734 4,638 04.751 $4,009 1,346) 32,603 3,738 79,746 $4,009 (39) $928 (31) $897 30 CTED CASH, BEGINNING OF YEAR 93 6 (118) $63,827 5 $64,194 58 ($1,146) 66 ($1,080) 3,781 33 (1,229) ($14,936) ($100,406) $94,918 13,027 (7,405) 2,212 26 ($16,165) ($105,573) 66 (7,551) (263) 108 $100,239 2020 $4,239 13,103 3,013 LEER (248) $385 76 (16) (88) $357 2019 $2,569 3,966 2,824 THE 2018 3,874 157 (366) $47,579 13,103 (1,245) (7,551) (263) (7,405) 2,574 174 (8) $46,878 $5,569 9,861 2,834 346 Jor Net earnings Depreciation and amortization Loss on early extinguishment of debt Share-based compensation expense Deferred income taxes $4,009 Consolidated Statements of Cash Flows Amounts in millions; Years ended June 30 CASH, CASH EQUIVALENTS AND RESTRICTED CASH, BEGINNING OF YEAR OPERATING ACTIVITIES Loss/(gain) on sale of assets Goodwill and indefinite-lived intangible impairment charges Change in accounts receivable Change in inventories Change in accounts payable, accrued and other liabilities Change in other operating assets and liabilities Other TOTAL OPERATING ACTIVITIES INVESTING ACTIVITIES Capital expenditures Proceeds from asset sales $897 Acquisitions, net of cash acquired Purchases of short-term investments Proceeds from sales and maturities of investment securities 2020 $ 4,239 13,103 3,013 - 558 (596) 7 - 634 (637) 1,923 (710) 108 17,403 (3,073) 30 (58) 6,151 (5) 3,045 ܝܝ (7,789) 2019 $2,569 3,966 2,824 515 (411) (678) 8,345 (276) (239) 1,856 (973) 313 15,242 (3,347) 394 (3,945) (158) 3,628 (62) (3,490) (7,498) ܘܘ 2018 $5,569 9,861 2,834 346 395 (1,844) (176) (177) (188) 1,385 2,000 431 14,867 (3,717) 269 (109) (3,909) 3,928 27 (3,511) (7,310) Other TOTAL OPERATING ACTIVITIES INVESTING ACTIVITIES Capital expenditures Proceeds from asset sales Acquisitions, net of cash acquired Purchases of short-term investments Proceeds from sales and maturities of investment securities Change in other investments TOTAL INVESTING ACTIVITIES FINANCING ACTIVITIES Dividends to shareholders i Increases/(reductions) in short-term debt Additions to long-term debt Reductions of long-term debt Treasury stock purchases Impact of stock options and other TOTAL FINANCING ACTIVITIES EFFECT OF EXCHANGE RATE CHANGES ON CASH, CASH EQUIVALENTS AND RESTRICTED CASH CHANGE IN CASH, CASH EQUIVALENTS AND RESTRICTED CASH CASH, CASH EQUIVALENTS AND RESTRICTED CASH, END OF YEAR SUPPLEMENTAL DISCLOSURE Cash payments for interest Cash payment for income taxes Assets acquired through non-cash finance leases are immaterial for all periods. Includes early outingui (710) 108 17,403 (3,073) 30 (58) - 6,151 (5) 3,045 (7,789) 2,345 4,951 (2,447) (7,405) 1,978 (8,367) (139) 11,942 $16,181 $434 3,550 (973) 313 15,242 (3,347) 394 (3,945) (158) 3,628 (62) (3,490) (7,498) (2,215) 2,367 (969) (5,003) 3,324 (9,994) (88) 1,670 $4,239 $497 3,064 2,000 431 14,867 (3,717) 269 (109) (3,909) 3,928 27 (3,511) (7,310) (3,437) 5,072 (2,873) (7,004) 1,177 (14,375) 19 (3,000) $ 2,569 $529 2,830 The financial statements of P&G are presented in Appendix B. The company's complete annual report, including the notes to the financial statements, is available online. Click here to view Appendix B. Refer to P&G's financial statements and the accompanying notes to answer the following questions. (c1) Compute P&G's gross profit for each of the years 2018-2020. (Enter amounts in million) Gross profit $ 2020 million 2019 million 2018 million Consolidated Statements of Earnings Amounts in millions except per share amounts; Years ended June 30 NET SALES Cost of products sold Selling, general and administrative expense Goodwill and indefinite-lived intangibles impairment charges OPERATING INCOME Interest expense Interest income Other non-operating income, net EARNINGS BEFORE INCOME TAXES Income taxes NET EARNINGS Less: Net earnings attributable to noncontrolling interests NET EARNINGS ATTRIBUTABLE TO PROCTER & GAMBLE¹ NET EARNINGS PER COMMON SHARE:² Basic Diluted 2020 $70,950 35,250 19,994 15,706 (465) 155 438 15,834 2,731 13,103 76 $13,027 $5.13 $4.96 2019 2020 $67,684 34,768 19,084 8,345 Gillette indefinite-lived intangible assets. 5,487 (509) 220 871 6,069 2,103 3,966 69 $3,897 $1.45 $1.43 $13,103 (1,083) (12) 2019 $3,966 (213) 184 2018 $66,832 34,432 19,037 13,363 (506) 247 222 13,326 3,465 9,861 111 9,750 $ 3.75 $3.67 2018 $9,861 (305) (148) Amounts in millions; Years ended June 30 NET EARNINGS Accounts receivable INVENTORIES Comprehensive Income OTHER COMPREHENSIVE INCOME/(LOSS), NET OF TAX Foreign currency translation (net of $59, $78 and $(279) tax, respectively) Unrealized gains/(losses) on investment securities (net of $(1), $0 and $0 tax, respectively) Unrealized gains/(losses) on defined benefit retirement plans (net of $(42), $22 and $68 tax, respectively) TOTAL OTHER COMPREHENSIVE INCOME/(LOSS), NET OF TAX TOTAL COMPREHENSIVE INCOME Less: Total comprehensive income attributable to noncontrolling interests TOTAL COMPREHENSIVE INCOME ATTRIBUTABLE TO PROCTER & GAMBLE Consolidated Balance Sheets Amounts in millions except stated values; As of June 30 Assets CURRENT ASSETS Cash and cash equivalents Available-for-sale investment securities Materials and supplies Work in process Finished goods uutav Total inventories Prepaid expenses and other current assets TOTAL CURRENT ASSETS PROPERTY DLANT AND EQUIPMENT NET 2020 $13,103 (1,083) (12) (150) (1,245) 11,858 60 $11,798 2020 2019 $3,966 (213) 184 169 140 4,106 70 $4,036 $ 16,181 - 4,178 1,414 674 3,410 5,498 2,130 27,987 20,692 39,901 23,792 8,328 $120.700 2019 2018 $9,861 (305) (148) 334 (119) 9,742 109 $9,633 $4,239 6,048 4,951 1,289 612 3,116 5,017 2,218 22,473 21,271 40,273 24,215 6,863 SL15095 Liabilities and Shareholders' Equity CURRENT LIABILITIES Accounts payable Accrued and other liabilities Debt due within one year TOTAL CURRENT LIABILITIES LONG-TERM DEBT DEFERRED INCOME TAXES OTHER NONCURRENT LIABILITIES TOTAL LIABILITIES SHAREHOLDERS' EQUITY Convertible Class A preferred stock, stated value $1 per share (600 shares authorized) Non-Voting Class B preferred stock, stated value $1 per share (200 shares authorized) Common stock, stated value $1 per share (10,000 shares authorized; shares issued: 2020-4,009.2, 2019-4,009.2) Additional paid-in capital Reserve for ESOP debt retirement Accumulated other comprehensive income/(loss) Treasury stock, at cost (shares held: 2020- 1,529.5, 2019 - 1,504.5) Retained earnings Noncontrolling interest TOTAL SHAREHOLDERS' EQUITY TOTAL LIABILITIES AND SHAREHOLDERS' EQUITY Consolidated Statements of Shareholders' Equity Acc 5) Retained Earnings $96,124 9,750 $ 12,071 9,722 11,183 32,976 23,537 6,199 11,110 73,822 897 4,009 64,194 (1,080) (16,165) (105,573) 100,239 Non- controlling Interest - 357 46,878 $120,700 $594 111 (2) $11,260 9,054 9,697 30,011 20,395 6,899 10,211 67,516 928 4,009 63,827 (1,146) (14,936) (100,406) 94,918 385 47,579 $115,095 Total Shareholders' Equity $55,778 9,861 (119) TOTAL LIABILITIES AND SHAREHOLDERS' EQUITY Consolidated Statements of Shareholders' Equity Dollars in millions except per share amounts; shares in thousands BALANCE JUNE 30, 2017 Net earnings Other comprehensive income/(loss) Dividends and dividend equivalents ($2.7860 per share): Common Preferred, net of tax benefits Treasury stock purchases Employee stock plans Preferred stock conversions ESOP debt impacts Noncontrolling interest, net. BALANCE JUNE 30, 2018 Impact of adoption of new accounting standards Net earnings Other comprehensive income/(loss) Dagdonde and decidand Common Stock Amount Shares 2,553,297 $4,009 (81,439) 21,655 4,580 2,498,093 $4,009 Preferred Stock $1,006 (39) $967 Additional Paid-In Capital $63,641 199 6 $63,846 Reserve for ESOP Debt Retirement ($1,249) 45 ($1,204) (326) 139 Accumulated Other Comprehensive Income/(Loss) Treasury Stock ($14,632) ($93,715) (117) ($14,749) (7,004) 1,469 33 ($99,217) (200) ANSWER 7 2 5 0 3 $4,009 4) Preferred Additional Reserve for ESOP Debt Retirement ($1,249) Amount Stock $4,009 $1,006 (39) $967 Paid-In Capital $63,641 199 6 $63,846 45 ($1,204) (326) 139 Accumulated Other Comprehensive Income/(Loss) Treasury Retained Stock Earnings ($14,632) ($93,715) $96,124 9,750 (117) ($14,749) (7,004) 1,469 33 ($99,217) (200) (5,003) (7,057) (265) 89 $98,641 (27) 3,897 (7,256) (263) Non- controlling Interest $594 111 (2) (113) $590 (553) 69 1 Total Shareholders' Equity $55,778 9,861 (119) (7,057) (265) (7,004) 1,668 134 $52,883 3,966 140 (7.256) (263) (5,003) Employee stock plans Preferred stock conversions ESOP debt impacts Noncontrolling interest, net BALANCE JUNE 30, 2019 Net earnings Other comprehensive income/(loss) Dividends and dividend equivalents ($3.0284 per share): Common Preferred, net of tax benefits Treasury stock purchases Employee stock plans Preferred stock conversions ESOP debt impacts Noncontrolling interest, net BALANCE JUNE 30, 2020 55,734 4,638 2,504,751 $4,009 (61,346) 32,603 3,738 2,479,746 $4,009 (39) $928 (31) $897 Consolidated Statements of Cash Flows Amounts in millions; Years ended June 30 CASH, CASH EQUIVALENTS AND RESTRICTED CASH, BEGINNING OF YEAR OPERATING ACTIVITIES Nat 93 6 (118) $63,827 362 5 $64,194 58 ($1,146) 66 ($1,080) 3,78 (1,229) 3 ($14,936) ($100,406 (7,405) 2,212 26 ($16,165) ($105,573) 55,734 4,638 04.751 $4,009 1,346) 32,603 3,738 79,746 $4,009 (39) $928 (31) $897 30 CTED CASH, BEGINNING OF YEAR 93 6 (118) $63,827 5 $64,194 58 ($1,146) 66 ($1,080) 3,781 33 (1,229) ($14,936) ($100,406) $94,918 13,027 (7,405) 2,212 26 ($16,165) ($105,573) 66 (7,551) (263) 108 $100,239 2020 $4,239 13,103 3,013 LEER (248) $385 76 (16) (88) $357 2019 $2,569 3,966 2,824 THE 2018 3,874 157 (366) $47,579 13,103 (1,245) (7,551) (263) (7,405) 2,574 174 (8) $46,878 $5,569 9,861 2,834 346 Jor Net earnings Depreciation and amortization Loss on early extinguishment of debt Share-based compensation expense Deferred income taxes $4,009 Consolidated Statements of Cash Flows Amounts in millions; Years ended June 30 CASH, CASH EQUIVALENTS AND RESTRICTED CASH, BEGINNING OF YEAR OPERATING ACTIVITIES Loss/(gain) on sale of assets Goodwill and indefinite-lived intangible impairment charges Change in accounts receivable Change in inventories Change in accounts payable, accrued and other liabilities Change in other operating assets and liabilities Other TOTAL OPERATING ACTIVITIES INVESTING ACTIVITIES Capital expenditures Proceeds from asset sales $897 Acquisitions, net of cash acquired Purchases of short-term investments Proceeds from sales and maturities of investment securities 2020 $ 4,239 13,103 3,013 - 558 (596) 7 - 634 (637) 1,923 (710) 108 17,403 (3,073) 30 (58) 6,151 (5) 3,045 ܝܝ (7,789) 2019 $2,569 3,966 2,824 515 (411) (678) 8,345 (276) (239) 1,856 (973) 313 15,242 (3,347) 394 (3,945) (158) 3,628 (62) (3,490) (7,498) ܘܘ 2018 $5,569 9,861 2,834 346 395 (1,844) (176) (177) (188) 1,385 2,000 431 14,867 (3,717) 269 (109) (3,909) 3,928 27 (3,511) (7,310) Other TOTAL OPERATING ACTIVITIES INVESTING ACTIVITIES Capital expenditures Proceeds from asset sales Acquisitions, net of cash acquired Purchases of short-term investments Proceeds from sales and maturities of investment securities Change in other investments TOTAL INVESTING ACTIVITIES FINANCING ACTIVITIES Dividends to shareholders i Increases/(reductions) in short-term debt Additions to long-term debt Reductions of long-term debt Treasury stock purchases Impact of stock options and other TOTAL FINANCING ACTIVITIES EFFECT OF EXCHANGE RATE CHANGES ON CASH, CASH EQUIVALENTS AND RESTRICTED CASH CHANGE IN CASH, CASH EQUIVALENTS AND RESTRICTED CASH CASH, CASH EQUIVALENTS AND RESTRICTED CASH, END OF YEAR SUPPLEMENTAL DISCLOSURE Cash payments for interest Cash payment for income taxes Assets acquired through non-cash finance leases are immaterial for all periods. Includes early outingui (710) 108 17,403 (3,073) 30 (58) - 6,151 (5) 3,045 (7,789) 2,345 4,951 (2,447) (7,405) 1,978 (8,367) (139) 11,942 $16,181 $434 3,550 (973) 313 15,242 (3,347) 394 (3,945) (158) 3,628 (62) (3,490) (7,498) (2,215) 2,367 (969) (5,003) 3,324 (9,994) (88) 1,670 $4,239 $497 3,064 2,000 431 14,867 (3,717) 269 (109) (3,909) 3,928 27 (3,511) (7,310) (3,437) 5,072 (2,873) (7,004) 1,177 (14,375) 19 (3,000) $ 2,569 $529 2,830 The financial statements of P&G are presented in Appendix B. The company's complete annual report, including the notes to the financial statements, is available online. Click here to view Appendix B. Refer to P&G's financial statements and the accompanying notes to answer the following questions. (c1) Compute P&G's gross profit for each of the years 2018-2020. (Enter amounts in million) Gross profit $ 2020 million 2019 million 2018 million Consolidated Statements of Earnings Amounts in millions except per share amounts; Years ended June 30 NET SALES Cost of products sold Selling, general and administrative expense Goodwill and indefinite-lived intangibles impairment charges OPERATING INCOME Interest expense Interest income Other non-operating income, net EARNINGS BEFORE INCOME TAXES Income taxes NET EARNINGS Less: Net earnings attributable to noncontrolling interests NET EARNINGS ATTRIBUTABLE TO PROCTER & GAMBLE¹ NET EARNINGS PER COMMON SHARE:² Basic Diluted 2020 $70,950 35,250 19,994 15,706 (465) 155 438 15,834 2,731 13,103 76 $13,027 $5.13 $4.96 2019 2020 $67,684 34,768 19,084 8,345 Gillette indefinite-lived intangible assets. 5,487 (509) 220 871 6,069 2,103 3,966 69 $3,897 $1.45 $1.43 $13,103 (1,083) (12) 2019 $3,966 (213) 184 2018 $66,832 34,432 19,037 13,363 (506) 247 222 13,326 3,465 9,861 111 9,750 $ 3.75 $3.67 2018 $9,861 (305) (148) Amounts in millions; Years ended June 30 NET EARNINGS Accounts receivable INVENTORIES Comprehensive Income OTHER COMPREHENSIVE INCOME/(LOSS), NET OF TAX Foreign currency translation (net of $59, $78 and $(279) tax, respectively) Unrealized gains/(losses) on investment securities (net of $(1), $0 and $0 tax, respectively) Unrealized gains/(losses) on defined benefit retirement plans (net of $(42), $22 and $68 tax, respectively) TOTAL OTHER COMPREHENSIVE INCOME/(LOSS), NET OF TAX TOTAL COMPREHENSIVE INCOME Less: Total comprehensive income attributable to noncontrolling interests TOTAL COMPREHENSIVE INCOME ATTRIBUTABLE TO PROCTER & GAMBLE Consolidated Balance Sheets Amounts in millions except stated values; As of June 30 Assets CURRENT ASSETS Cash and cash equivalents Available-for-sale investment securities Materials and supplies Work in process Finished goods uutav Total inventories Prepaid expenses and other current assets TOTAL CURRENT ASSETS PROPERTY DLANT AND EQUIPMENT NET 2020 $13,103 (1,083) (12) (150) (1,245) 11,858 60 $11,798 2020 2019 $3,966 (213) 184 169 140 4,106 70 $4,036 $ 16,181 - 4,178 1,414 674 3,410 5,498 2,130 27,987 20,692 39,901 23,792 8,328 $120.700 2019 2018 $9,861 (305) (148) 334 (119) 9,742 109 $9,633 $4,239 6,048 4,951 1,289 612 3,116 5,017 2,218 22,473 21,271 40,273 24,215 6,863 SL15095 Liabilities and Shareholders' Equity CURRENT LIABILITIES Accounts payable Accrued and other liabilities Debt due within one year TOTAL CURRENT LIABILITIES LONG-TERM DEBT DEFERRED INCOME TAXES OTHER NONCURRENT LIABILITIES TOTAL LIABILITIES SHAREHOLDERS' EQUITY Convertible Class A preferred stock, stated value $1 per share (600 shares authorized) Non-Voting Class B preferred stock, stated value $1 per share (200 shares authorized) Common stock, stated value $1 per share (10,000 shares authorized; shares issued: 2020-4,009.2, 2019-4,009.2) Additional paid-in capital Reserve for ESOP debt retirement Accumulated other comprehensive income/(loss) Treasury stock, at cost (shares held: 2020- 1,529.5, 2019 - 1,504.5) Retained earnings Noncontrolling interest TOTAL SHAREHOLDERS' EQUITY TOTAL LIABILITIES AND SHAREHOLDERS' EQUITY Consolidated Statements of Shareholders' Equity Acc 5) Retained Earnings $96,124 9,750 $ 12,071 9,722 11,183 32,976 23,537 6,199 11,110 73,822 897 4,009 64,194 (1,080) (16,165) (105,573) 100,239 Non- controlling Interest - 357 46,878 $120,700 $594 111 (2) $11,260 9,054 9,697 30,011 20,395 6,899 10,211 67,516 928 4,009 63,827 (1,146) (14,936) (100,406) 94,918 385 47,579 $115,095 Total Shareholders' Equity $55,778 9,861 (119) TOTAL LIABILITIES AND SHAREHOLDERS' EQUITY Consolidated Statements of Shareholders' Equity Dollars in millions except per share amounts; shares in thousands BALANCE JUNE 30, 2017 Net earnings Other comprehensive income/(loss) Dividends and dividend equivalents ($2.7860 per share): Common Preferred, net of tax benefits Treasury stock purchases Employee stock plans Preferred stock conversions ESOP debt impacts Noncontrolling interest, net. BALANCE JUNE 30, 2018 Impact of adoption of new accounting standards Net earnings Other comprehensive income/(loss) Dagdonde and decidand Common Stock Amount Shares 2,553,297 $4,009 (81,439) 21,655 4,580 2,498,093 $4,009 Preferred Stock $1,006 (39) $967 Additional Paid-In Capital $63,641 199 6 $63,846 Reserve for ESOP Debt Retirement ($1,249) 45 ($1,204) (326) 139 Accumulated Other Comprehensive Income/(Loss) Treasury Stock ($14,632) ($93,715) (117) ($14,749) (7,004) 1,469 33 ($99,217) (200) ANSWER 7 2 5 0 3 $4,009 4) Preferred Additional Reserve for ESOP Debt Retirement ($1,249) Amount Stock $4,009 $1,006 (39) $967 Paid-In Capital $63,641 199 6 $63,846 45 ($1,204) (326) 139 Accumulated Other Comprehensive Income/(Loss) Treasury Retained Stock Earnings ($14,632) ($93,715) $96,124 9,750 (117) ($14,749) (7,004) 1,469 33 ($99,217) (200) (5,003) (7,057) (265) 89 $98,641 (27) 3,897 (7,256) (263) Non- controlling Interest $594 111 (2) (113) $590 (553) 69 1 Total Shareholders' Equity $55,778 9,861 (119) (7,057) (265) (7,004) 1,668 134 $52,883 3,966 140 (7.256) (263) (5,003) Employee stock plans Preferred stock conversions ESOP debt impacts Noncontrolling interest, net BALANCE JUNE 30, 2019 Net earnings Other comprehensive income/(loss) Dividends and dividend equivalents ($3.0284 per share): Common Preferred, net of tax benefits Treasury stock purchases Employee stock plans Preferred stock conversions ESOP debt impacts Noncontrolling interest, net BALANCE JUNE 30, 2020 55,734 4,638 2,504,751 $4,009 (61,346) 32,603 3,738 2,479,746 $4,009 (39) $928 (31) $897 Consolidated Statements of Cash Flows Amounts in millions; Years ended June 30 CASH, CASH EQUIVALENTS AND RESTRICTED CASH, BEGINNING OF YEAR OPERATING ACTIVITIES Nat 93 6 (118) $63,827 362 5 $64,194 58 ($1,146) 66 ($1,080) 3,78 (1,229) 3 ($14,936) ($100,406 (7,405) 2,212 26 ($16,165) ($105,573) 55,734 4,638 04.751 $4,009 1,346) 32,603 3,738 79,746 $4,009 (39) $928 (31) $897 30 CTED CASH, BEGINNING OF YEAR 93 6 (118) $63,827 5 $64,194 58 ($1,146) 66 ($1,080) 3,781 33 (1,229) ($14,936) ($100,406) $94,918 13,027 (7,405) 2,212 26 ($16,165) ($105,573) 66 (7,551) (263) 108 $100,239 2020 $4,239 13,103 3,013 LEER (248) $385 76 (16) (88) $357 2019 $2,569 3,966 2,824 THE 2018 3,874 157 (366) $47,579 13,103 (1,245) (7,551) (263) (7,405) 2,574 174 (8) $46,878 $5,569 9,861 2,834 346 Jor Net earnings Depreciation and amortization Loss on early extinguishment of debt Share-based compensation expense Deferred income taxes $4,009 Consolidated Statements of Cash Flows Amounts in millions; Years ended June 30 CASH, CASH EQUIVALENTS AND RESTRICTED CASH, BEGINNING OF YEAR OPERATING ACTIVITIES Loss/(gain) on sale of assets Goodwill and indefinite-lived intangible impairment charges Change in accounts receivable Change in inventories Change in accounts payable, accrued and other liabilities Change in other operating assets and liabilities Other TOTAL OPERATING ACTIVITIES INVESTING ACTIVITIES Capital expenditures Proceeds from asset sales $897 Acquisitions, net of cash acquired Purchases of short-term investments Proceeds from sales and maturities of investment securities 2020 $ 4,239 13,103 3,013 - 558 (596) 7 - 634 (637) 1,923 (710) 108 17,403 (3,073) 30 (58) 6,151 (5) 3,045 ܝܝ (7,789) 2019 $2,569 3,966 2,824 515 (411) (678) 8,345 (276) (239) 1,856 (973) 313 15,242 (3,347) 394 (3,945) (158) 3,628 (62) (3,490) (7,498) ܘܘ 2018 $5,569 9,861 2,834 346 395 (1,844) (176) (177) (188) 1,385 2,000 431 14,867 (3,717) 269 (109) (3,909) 3,928 27 (3,511) (7,310) Other TOTAL OPERATING ACTIVITIES INVESTING ACTIVITIES Capital expenditures Proceeds from asset sales Acquisitions, net of cash acquired Purchases of short-term investments Proceeds from sales and maturities of investment securities Change in other investments TOTAL INVESTING ACTIVITIES FINANCING ACTIVITIES Dividends to shareholders i Increases/(reductions) in short-term debt Additions to long-term debt Reductions of long-term debt Treasury stock purchases Impact of stock options and other TOTAL FINANCING ACTIVITIES EFFECT OF EXCHANGE RATE CHANGES ON CASH, CASH EQUIVALENTS AND RESTRICTED CASH CHANGE IN CASH, CASH EQUIVALENTS AND RESTRICTED CASH CASH, CASH EQUIVALENTS AND RESTRICTED CASH, END OF YEAR SUPPLEMENTAL DISCLOSURE Cash payments for interest Cash payment for income taxes Assets acquired through non-cash finance leases are immaterial for all periods. Includes early outingui (710) 108 17,403 (3,073) 30 (58) - 6,151 (5) 3,045 (7,789) 2,345 4,951 (2,447) (7,405) 1,978 (8,367) (139) 11,942 $16,181 $434 3,550 (973) 313 15,242 (3,347) 394 (3,945) (158) 3,628 (62) (3,490) (7,498) (2,215) 2,367 (969) (5,003) 3,324 (9,994) (88) 1,670 $4,239 $497 3,064 2,000 431 14,867 (3,717) 269 (109) (3,909) 3,928 27 (3,511) (7,310) (3,437) 5,072 (2,873) (7,004) 1,177 (14,375) 19 (3,000) $ 2,569 $529 2,830 The financial statements of P&G are presented in Appendix B. The company's complete annual report, including the notes to the financial statements, is available online. Click here to view Appendix B. Refer to P&G's financial statements and the accompanying notes to answer the following questions. (c1) Compute P&G's gross profit for each of the years 2018-2020. (Enter amounts in million) Gross profit $ 2020 million 2019 million 2018 million Consolidated Statements of Earnings Amounts in millions except per share amounts; Years ended June 30 NET SALES Cost of products sold Selling, general and administrative expense Goodwill and indefinite-lived intangibles impairment charges OPERATING INCOME Interest expense Interest income Other non-operating income, net EARNINGS BEFORE INCOME TAXES Income taxes NET EARNINGS Less: Net earnings attributable to noncontrolling interests NET EARNINGS ATTRIBUTABLE TO PROCTER & GAMBLE¹ NET EARNINGS PER COMMON SHARE:² Basic Diluted 2020 $70,950 35,250 19,994 15,706 (465) 155 438 15,834 2,731 13,103 76 $13,027 $5.13 $4.96 2019 2020 $67,684 34,768 19,084 8,345 Gillette indefinite-lived intangible assets. 5,487 (509) 220 871 6,069 2,103 3,966 69 $3,897 $1.45 $1.43 $13,103 (1,083) (12) 2019 $3,966 (213) 184 2018 $66,832 34,432 19,037 13,363 (506) 247 222 13,326 3,465 9,861 111 9,750 $ 3.75 $3.67 2018 $9,861 (305) (148) Amounts in millions; Years ended June 30 NET EARNINGS Accounts receivable INVENTORIES Comprehensive Income OTHER COMPREHENSIVE INCOME/(LOSS), NET OF TAX Foreign currency translation (net of $59, $78 and $(279) tax, respectively) Unrealized gains/(losses) on investment securities (net of $(1), $0 and $0 tax, respectively) Unrealized gains/(losses) on defined benefit retirement plans (net of $(42), $22 and $68 tax, respectively) TOTAL OTHER COMPREHENSIVE INCOME/(LOSS), NET OF TAX TOTAL COMPREHENSIVE INCOME Less: Total comprehensive income attributable to noncontrolling interests TOTAL COMPREHENSIVE INCOME ATTRIBUTABLE TO PROCTER & GAMBLE Consolidated Balance Sheets Amounts in millions except stated values; As of June 30 Assets CURRENT ASSETS Cash and cash equivalents Available-for-sale investment securities Materials and supplies Work in process Finished goods uutav Total inventories Prepaid expenses and other current assets TOTAL CURRENT ASSETS PROPERTY DLANT AND EQUIPMENT NET 2020 $13,103 (1,083) (12) (150) (1,245) 11,858 60 $11,798 2020 2019 $3,966 (213) 184 169 140 4,106 70 $4,036 $ 16,181 - 4,178 1,414 674 3,410 5,498 2,130 27,987 20,692 39,901 23,792 8,328 $120.700 2019 2018 $9,861 (305) (148) 334 (119) 9,742 109 $9,633 $4,239 6,048 4,951 1,289 612 3,116 5,017 2,218 22,473 21,271 40,273 24,215 6,863 SL15095 Liabilities and Shareholders' Equity CURRENT LIABILITIES Accounts payable Accrued and other liabilities Debt due within one year TOTAL CURRENT LIABILITIES LONG-TERM DEBT DEFERRED INCOME TAXES OTHER NONCURRENT LIABILITIES TOTAL LIABILITIES SHAREHOLDERS' EQUITY Convertible Class A preferred stock, stated value $1 per share (600 shares authorized) Non-Voting Class B preferred stock, stated value $1 per share (200 shares authorized) Common stock, stated value $1 per share (10,000 shares authorized; shares issued: 2020-4,009.2, 2019-4,009.2) Additional paid-in capital Reserve for ESOP debt retirement Accumulated other comprehensive income/(loss) Treasury stock, at cost (shares held: 2020- 1,529.5, 2019 - 1,504.5) Retained earnings Noncontrolling interest TOTAL SHAREHOLDERS' EQUITY TOTAL LIABILITIES AND SHAREHOLDERS' EQUITY Consolidated Statements of Shareholders' Equity Acc 5) Retained Earnings $96,124 9,750 $ 12,071 9,722 11,183 32,976 23,537 6,199 11,110 73,822 897 4,009 64,194 (1,080) (16,165) (105,573) 100,239 Non- controlling Interest - 357 46,878 $120,700 $594 111 (2) $11,260 9,054 9,697 30,011 20,395 6,899 10,211 67,516 928 4,009 63,827 (1,146) (14,936) (100,406) 94,918 385 47,579 $115,095 Total Shareholders' Equity $55,778 9,861 (119) TOTAL LIABILITIES AND SHAREHOLDERS' EQUITY Consolidated Statements of Shareholders' Equity Dollars in millions except per share amounts; shares in thousands BALANCE JUNE 30, 2017 Net earnings Other comprehensive income/(loss) Dividends and dividend equivalents ($2.7860 per share): Common Preferred, net of tax benefits Treasury stock purchases Employee stock plans Preferred stock conversions ESOP debt impacts Noncontrolling interest, net. BALANCE JUNE 30, 2018 Impact of adoption of new accounting standards Net earnings Other comprehensive income/(loss) Dagdonde and decidand Common Stock Amount Shares 2,553,297 $4,009 (81,439) 21,655 4,580 2,498,093 $4,009 Preferred Stock $1,006 (39) $967 Additional Paid-In Capital $63,641 199 6 $63,846 Reserve for ESOP Debt Retirement ($1,249) 45 ($1,204) (326) 139 Accumulated Other Comprehensive Income/(Loss) Treasury Stock ($14,632) ($93,715) (117) ($14,749) (7,004) 1,469 33 ($99,217) (200) ANSWER 7 2 5 0 3 $4,009 4) Preferred Additional Reserve for ESOP Debt Retirement ($1,249) Amount Stock $4,009 $1,006 (39) $967 Paid-In Capital $63,641 199 6 $63,846 45 ($1,204) (326) 139 Accumulated Other Comprehensive Income/(Loss) Treasury Retained Stock Earnings ($14,632) ($93,715) $96,124 9,750 (117) ($14,749) (7,004) 1,469 33 ($99,217) (200) (5,003) (7,057) (265) 89 $98,641 (27) 3,897 (7,256) (263) Non- controlling Interest $594 111 (2) (113) $590 (553) 69 1 Total Shareholders' Equity $55,778 9,861 (119) (7,057) (265) (7,004) 1,668 134 $52,883 3,966 140 (7.256) (263) (5,003) Employee stock plans Preferred stock conversions ESOP debt impacts Noncontrolling interest, net BALANCE JUNE 30, 2019 Net earnings Other comprehensive income/(loss) Dividends and dividend equivalents ($3.0284 per share): Common Preferred, net of tax benefits Treasury stock purchases Employee stock plans Preferred stock conversions ESOP debt impacts Noncontrolling interest, net BALANCE JUNE 30, 2020 55,734 4,638 2,504,751 $4,009 (61,346) 32,603 3,738 2,479,746 $4,009 (39) $928 (31) $897 Consolidated Statements of Cash Flows Amounts in millions; Years ended June 30 CASH, CASH EQUIVALENTS AND RESTRICTED CASH, BEGINNING OF YEAR OPERATING ACTIVITIES Nat 93 6 (118) $63,827 362 5 $64,194 58 ($1,146) 66 ($1,080) 3,78 (1,229) 3 ($14,936) ($100,406 (7,405) 2,212 26 ($16,165) ($105,573) 55,734 4,638 04.751 $4,009 1,346) 32,603 3,738 79,746 $4,009 (39) $928 (31) $897 30 CTED CASH, BEGINNING OF YEAR 93 6 (118) $63,827 5 $64,194 58 ($1,146) 66 ($1,080) 3,781 33 (1,229) ($14,936) ($100,406) $94,918 13,027 (7,405) 2,212 26 ($16,165) ($105,573) 66 (7,551) (263) 108 $100,239 2020 $4,239 13,103 3,013 LEER (248) $385 76 (16) (88) $357 2019 $2,569 3,966 2,824 THE 2018 3,874 157 (366) $47,579 13,103 (1,245) (7,551) (263) (7,405) 2,574 174 (8) $46,878 $5,569 9,861 2,834 346 Jor Net earnings Depreciation and amortization Loss on early extinguishment of debt Share-based compensation expense Deferred income taxes $4,009 Consolidated Statements of Cash Flows Amounts in millions; Years ended June 30 CASH, CASH EQUIVALENTS AND RESTRICTED CASH, BEGINNING OF YEAR OPERATING ACTIVITIES Loss/(gain) on sale of assets Goodwill and indefinite-lived intangible impairment charges Change in accounts receivable Change in inventories Change in accounts payable, accrued and other liabilities Change in other operating assets and liabilities Other TOTAL OPERATING ACTIVITIES INVESTING ACTIVITIES Capital expenditures Proceeds from asset sales $897 Acquisitions, net of cash acquired Purchases of short-term investments Proceeds from sales and maturities of investment securities 2020 $ 4,239 13,103 3,013 - 558 (596) 7 - 634 (637) 1,923 (710) 108 17,403 (3,073) 30 (58) 6,151 (5) 3,045 ܝܝ (7,789) 2019 $2,569 3,966 2,824 515 (411) (678) 8,345 (276) (239) 1,856 (973) 313 15,242 (3,347) 394 (3,945) (158) 3,628 (62) (3,490) (7,498) ܘܘ 2018 $5,569 9,861 2,834 346 395 (1,844) (176) (177) (188) 1,385 2,000 431 14,867 (3,717) 269 (109) (3,909) 3,928 27 (3,511) (7,310) Other TOTAL OPERATING ACTIVITIES INVESTING ACTIVITIES Capital expenditures Proceeds from asset sales Acquisitions, net of cash acquired Purchases of short-term investments Proceeds from sales and maturities of investment securities Change in other investments TOTAL INVESTING ACTIVITIES FINANCING ACTIVITIES Dividends to shareholders i Increases/(reductions) in short-term debt Additions to long-term debt Reductions of long-term debt Treasury stock purchases Impact of stock options and other TOTAL FINANCING ACTIVITIES EFFECT OF EXCHANGE RATE CHANGES ON CASH, CASH EQUIVALENTS AND RESTRICTED CASH CHANGE IN CASH, CASH EQUIVALENTS AND RESTRICTED CASH CASH, CASH EQUIVALENTS AND RESTRICTED CASH, END OF YEAR SUPPLEMENTAL DISCLOSURE Cash payments for interest Cash payment for income taxes Assets acquired through non-cash finance leases are immaterial for all periods. Includes early outingui (710) 108 17,403 (3,073) 30 (58) - 6,151 (5) 3,045 (7,789) 2,345 4,951 (2,447) (7,405) 1,978 (8,367) (139) 11,942 $16,181 $434 3,550 (973) 313 15,242 (3,347) 394 (3,945) (158) 3,628 (62) (3,490) (7,498) (2,215) 2,367 (969) (5,003) 3,324 (9,994) (88) 1,670 $4,239 $497 3,064 2,000 431 14,867 (3,717) 269 (109) (3,909) 3,928 27 (3,511) (7,310) (3,437) 5,072 (2,873) (7,004) 1,177 (14,375) 19 (3,000) $ 2,569 $529 2,830 The financial statements of P&G are presented in Appendix B. The company's complete annual report, including the notes to the financial statements, is available online. Click here to view Appendix B. Refer to P&G's financial statements and the accompanying notes to answer the following questions. (c1) Compute P&G's gross profit for each of the years 2018-2020. (Enter amounts in million) Gross profit $ 2020 million 2019 million 2018 million Consolidated Statements of Earnings Amounts in millions except per share amounts; Years ended June 30 NET SALES Cost of products sold Selling, general and administrative expense Goodwill and indefinite-lived intangibles impairment charges OPERATING INCOME Interest expense Interest income Other non-operating income, net EARNINGS BEFORE INCOME TAXES Income taxes NET EARNINGS Less: Net earnings attributable to noncontrolling interests NET EARNINGS ATTRIBUTABLE TO PROCTER & GAMBLE¹ NET EARNINGS PER COMMON SHARE:² Basic Diluted 2020 $70,950 35,250 19,994 15,706 (465) 155 438 15,834 2,731 13,103 76 $13,027 $5.13 $4.96 2019 2020 $67,684 34,768 19,084 8,345 Gillette indefinite-lived intangible assets. 5,487 (509) 220 871 6,069 2,103 3,966 69 $3,897 $1.45 $1.43 $13,103 (1,083) (12) 2019 $3,966 (213) 184 2018 $66,832 34,432 19,037 13,363 (506) 247 222 13,326 3,465 9,861 111 9,750 $ 3.75 $3.67 2018 $9,861 (305) (148) Amounts in millions; Years ended June 30 NET EARNINGS Accounts receivable INVENTORIES Comprehensive Income OTHER COMPREHENSIVE INCOME/(LOSS), NET OF TAX Foreign currency translation (net of $59, $78 and $(279) tax, respectively) Unrealized gains/(losses) on investment securities (net of $(1), $0 and $0 tax, respectively) Unrealized gains/(losses) on defined benefit retirement plans (net of $(42), $22 and $68 tax, respectively) TOTAL OTHER COMPREHENSIVE INCOME/(LOSS), NET OF TAX TOTAL COMPREHENSIVE INCOME Less: Total comprehensive income attributable to noncontrolling interests TOTAL COMPREHENSIVE INCOME ATTRIBUTABLE TO PROCTER & GAMBLE Consolidated Balance Sheets Amounts in millions except stated values; As of June 30 Assets CURRENT ASSETS Cash and cash equivalents Available-for-sale investment securities Materials and supplies Work in process Finished goods uutav Total inventories Prepaid expenses and other current assets TOTAL CURRENT ASSETS PROPERTY DLANT AND EQUIPMENT NET 2020 $13,103 (1,083) (12) (150) (1,245) 11,858 60 $11,798 2020 2019 $3,966 (213) 184 169 140 4,106 70 $4,036 $ 16,181 - 4,178 1,414 674 3,410 5,498 2,130 27,987 20,692 39,901 23,792 8,328 $120.700 2019 2018 $9,861 (305) (148) 334 (119) 9,742 109 $9,633 $4,239 6,048 4,951 1,289 612 3,116 5,017 2,218 22,473 21,271 40,273 24,215 6,863 SL15095 Liabilities and Shareholders' Equity CURRENT LIABILITIES Accounts payable Accrued and other liabilities Debt due within one year TOTAL CURRENT LIABILITIES LONG-TERM DEBT DEFERRED INCOME TAXES OTHER NONCURRENT LIABILITIES TOTAL LIABILITIES SHAREHOLDERS' EQUITY Convertible Class A preferred stock, stated value $1 per share (600 shares authorized) Non-Voting Class B preferred stock, stated value $1 per share (200 shares authorized) Common stock, stated value $1 per share (10,000 shares authorized; shares issued: 2020-4,009.2, 2019-4,009.2) Additional paid-in capital Reserve for ESOP debt retirement Accumulated other comprehensive income/(loss) Treasury stock, at cost (shares held: 2020- 1,529.5, 2019 - 1,504.5) Retained earnings Noncontrolling interest TOTAL SHAREHOLDERS' EQUITY TOTAL LIABILITIES AND SHAREHOLDERS' EQUITY Consolidated Statements of Shareholders' Equity Acc 5) Retained Earnings $96,124 9,750 $ 12,071 9,722 11,183 32,976 23,537 6,199 11,110 73,822 897 4,009 64,194 (1,080) (16,165) (105,573) 100,239 Non- controlling Interest - 357 46,878 $120,700 $594 111 (2) $11,260 9,054 9,697 30,011 20,395 6,899 10,211 67,516 928 4,009 63,827 (1,146) (14,936) (100,406) 94,918 385 47,579 $115,095 Total Shareholders' Equity $55,778 9,861 (119) TOTAL LIABILITIES AND SHAREHOLDERS' EQUITY Consolidated Statements of Shareholders' Equity Dollars in millions except per share amounts; shares in thousands BALANCE JUNE 30, 2017 Net earnings Other comprehensive income/(loss) Dividends and dividend equivalents ($2.7860 per share): Common Preferred, net of tax benefits Treasury stock purchases Employee stock plans Preferred stock conversions ESOP debt impacts Noncontrolling interest, net. BALANCE JUNE 30, 2018 Impact of adoption of new accounting standards Net earnings Other comprehensive income/(loss) Dagdonde and decidand Common Stock Amount Shares 2,553,297 $4,009 (81,439) 21,655 4,580 2,498,093 $4,009 Preferred Stock $1,006 (39) $967 Additional Paid-In Capital $63,641 199 6 $63,846 Reserve for ESOP Debt Retirement ($1,249) 45 ($1,204) (326) 139 Accumulated Other Comprehensive Income/(Loss) Treasury Stock ($14,632) ($93,715) (117) ($14,749) (7,004) 1,469 33 ($99,217) (200) ANSWER 7 2 5 0 3 $4,009 4) Preferred Additional Reserve for ESOP Debt Retirement ($1,249) Amount Stock $4,009 $1,006 (39) $967 Paid-In Capital $63,641 199 6 $63,846 45 ($1,204) (326) 139 Accumulated Other Comprehensive Income/(Loss) Treasury Retained Stock Earnings ($14,632) ($93,715) $96,124 9,750 (117) ($14,749) (7,004) 1,469 33 ($99,217) (200) (5,003) (7,057) (265) 89 $98,641 (27) 3,897 (7,256) (263) Non- controlling Interest $594 111 (2) (113) $590 (553) 69 1 Total Shareholders' Equity $55,778 9,861 (119) (7,057) (265) (7,004) 1,668 134 $52,883 3,966 140 (7.256) (263) (5,003) Employee stock plans Preferred stock conversions ESOP debt impacts Noncontrolling interest, net BALANCE JUNE 30, 2019 Net earnings Other comprehensive income/(loss) Dividends and dividend equivalents ($3.0284 per share): Common Preferred, net of tax benefits Treasury stock purchases Employee stock plans Preferred stock conversions ESOP debt impacts Noncontrolling interest, net BALANCE JUNE 30, 2020 55,734 4,638 2,504,751 $4,009 (61,346) 32,603 3,738 2,479,746 $4,009 (39) $928 (31) $897 Consolidated Statements of Cash Flows Amounts in millions; Years ended June 30 CASH, CASH EQUIVALENTS AND RESTRICTED CASH, BEGINNING OF YEAR OPERATING ACTIVITIES Nat 93 6 (118) $63,827 362 5 $64,194 58 ($1,146) 66 ($1,080) 3,78 (1,229) 3 ($14,936) ($100,406 (7,405) 2,212 26 ($16,165) ($105,573) 55,734 4,638 04.751 $4,009 1,346) 32,603 3,738 79,746 $4,009 (39) $928 (31) $897 30 CTED CASH, BEGINNING OF YEAR 93 6 (118) $63,827 5 $64,194 58 ($1,146) 66 ($1,080) 3,781 33 (1,229) ($14,936) ($100,406) $94,918 13,027 (7,405) 2,212 26 ($16,165) ($105,573) 66 (7,551) (263) 108 $100,239 2020 $4,239 13,103 3,013 LEER (248) $385 76 (16) (88) $357 2019 $2,569 3,966 2,824 THE 2018 3,874 157 (366) $47,579 13,103 (1,245) (7,551) (263) (7,405) 2,574 174 (8) $46,878 $5,569 9,861 2,834 346 Jor Net earnings Depreciation and amortization Loss on early extinguishment of debt Share-based compensation expense Deferred income taxes $4,009 Consolidated Statements of Cash Flows Amounts in millions; Years ended June 30 CASH, CASH EQUIVALENTS AND RESTRICTED CASH, BEGINNING OF YEAR OPERATING ACTIVITIES Loss/(gain) on sale of assets Goodwill and indefinite-lived intangible impairment charges Change in accounts receivable Change in inventories Change in accounts payable, accrued and other liabilities Change in other operating assets and liabilities Other TOTAL OPERATING ACTIVITIES INVESTING ACTIVITIES Capital expenditures Proceeds from asset sales $897 Acquisitions, net of cash acquired Purchases of short-term investments Proceeds from sales and maturities of investment securities 2020 $ 4,239 13,103 3,013 - 558 (596) 7 - 634 (637) 1,923 (710) 108 17,403 (3,073) 30 (58) 6,151 (5) 3,045 ܝܝ (7,789) 2019 $2,569 3,966 2,824 515 (411) (678) 8,345 (276) (239) 1,856 (973) 313 15,242 (3,347) 394 (3,945) (158) 3,628 (62) (3,490) (7,498) ܘܘ 2018 $5,569 9,861 2,834 346 395 (1,844) (176) (177) (188) 1,385 2,000 431 14,867 (3,717) 269 (109) (3,909) 3,928 27 (3,511) (7,310) Other TOTAL OPERATING ACTIVITIES INVESTING ACTIVITIES Capital expenditures Proceeds from asset sales Acquisitions, net of cash acquired Purchases of short-term investments Proceeds from sales and maturities of investment securities Change in other investments TOTAL INVESTING ACTIVITIES FINANCING ACTIVITIES Dividends to shareholders i Increases/(reductions) in short-term debt Additions to long-term debt Reductions of long-term debt Treasury stock purchases Impact of stock options and other TOTAL FINANCING ACTIVITIES EFFECT OF EXCHANGE RATE CHANGES ON CASH, CASH EQUIVALENTS AND RESTRICTED CASH CHANGE IN CASH, CASH EQUIVALENTS AND RESTRICTED CASH CASH, CASH EQUIVALENTS AND RESTRICTED CASH, END OF YEAR SUPPLEMENTAL DISCLOSURE Cash payments for interest Cash payment for income taxes Assets acquired through non-cash finance leases are immaterial for all periods. Includes early outingui (710) 108 17,403 (3,073) 30 (58) - 6,151 (5) 3,045 (7,789) 2,345 4,951 (2,447) (7,405) 1,978 (8,367) (139) 11,942 $16,181 $434 3,550 (973) 313 15,242 (3,347) 394 (3,945) (158) 3,628 (62) (3,490) (7,498) (2,215) 2,367 (969) (5,003) 3,324 (9,994) (88) 1,670 $4,239 $497 3,064 2,000 431 14,867 (3,717) 269 (109) (3,909) 3,928 27 (3,511) (7,310) (3,437) 5,072 (2,873) (7,004) 1,177 (14,375) 19 (3,000) $ 2,569 $529 2,830 The financial statements of P&G are presented in Appendix B. The company's complete annual report, including the notes to the financial statements, is available online. Click here to view Appendix B. Refer to P&G's financial statements and the accompanying notes to answer the following questions. (c1) Compute P&G's gross profit for each of the years 2018-2020. (Enter amounts in million) Gross profit $ 2020 million 2019 million 2018 million Consolidated Statements of Earnings Amounts in millions except per share amounts; Years ended June 30 NET SALES Cost of products sold Selling, general and administrative expense Goodwill and indefinite-lived intangibles impairment charges OPERATING INCOME Interest expense Interest income Other non-operating income, net EARNINGS BEFORE INCOME TAXES Income taxes NET EARNINGS Less: Net earnings attributable to noncontrolling interests NET EARNINGS ATTRIBUTABLE TO PROCTER & GAMBLE¹ NET EARNINGS PER COMMON SHARE:² Basic Diluted 2020 $70,950 35,250 19,994 15,706 (465) 155 438 15,834 2,731 13,103 76 $13,027 $5.13 $4.96 2019 2020 $67,684 34,768 19,084 8,345 Gillette indefinite-lived intangible assets. 5,487 (509) 220 871 6,069 2,103 3,966 69 $3,897 $1.45 $1.43 $13,103 (1,083) (12) 2019 $3,966 (213) 184 2018 $66,832 34,432 19,037 13,363 (506) 247 222 13,326 3,465 9,861 111 9,750 $ 3.75 $3.67 2018 $9,861 (305) (148) Amounts in millions; Years ended June 30 NET EARNINGS Accounts receivable INVENTORIES Comprehensive Income OTHER COMPREHENSIVE INCOME/(LOSS), NET OF TAX Foreign currency translation (net of $59, $78 and $(279) tax, respectively) Unrealized gains/(losses) on investment securities (net of $(1), $0 and $0 tax, respectively) Unrealized gains/(losses) on defined benefit retirement plans (net of $(42), $22 and $68 tax, respectively) TOTAL OTHER COMPREHENSIVE INCOME/(LOSS), NET OF TAX TOTAL COMPREHENSIVE INCOME Less: Total comprehensive income attributable to noncontrolling interests TOTAL COMPREHENSIVE INCOME ATTRIBUTABLE TO PROCTER & GAMBLE Consolidated Balance Sheets Amounts in millions except stated values; As of June 30 Assets CURRENT ASSETS Cash and cash equivalents Available-for-sale investment securities Materials and supplies Work in process Finished goods uutav Total inventories Prepaid expenses and other current assets TOTAL CURRENT ASSETS PROPERTY DLANT AND EQUIPMENT NET 2020 $13,103 (1,083) (12) (150) (1,245) 11,858 60 $11,798 2020 2019 $3,966 (213) 184 169 140 4,106 70 $4,036 $ 16,181 - 4,178 1,414 674 3,410 5,498 2,130 27,987 20,692 39,901 23,792 8,328 $120.700 2019 2018 $9,861 (305) (148) 334 (119) 9,742 109 $9,633 $4,239 6,048 4,951 1,289 612 3,116 5,017 2,218 22,473 21,271 40,273 24,215 6,863 SL15095 Liabilities and Shareholders' Equity CURRENT LIABILITIES Accounts payable Accrued and other liabilities Debt due within one year TOTAL CURRENT LIABILITIES LONG-TERM DEBT DEFERRED INCOME TAXES OTHER NONCURRENT LIABILITIES TOTAL LIABILITIES SHAREHOLDERS' EQUITY Convertible Class A preferred stock, stated value $1 per share (600 shares authorized) Non-Voting Class B preferred stock, stated value $1 per share (200 shares authorized) Common stock, stated value $1 per share (10,000 shares authorized; shares issued: 2020-4,009.2, 2019-4,009.2) Additional paid-in capital Reserve for ESOP debt retirement Accumulated other comprehensive income/(loss) Treasury stock, at cost (shares held: 2020- 1,529.5, 2019 - 1,504.5) Retained earnings Noncontrolling interest TOTAL SHAREHOLDERS' EQUITY TOTAL LIABILITIES AND SHAREHOLDERS' EQUITY Consolidated Statements of Shareholders' Equity Acc 5) Retained Earnings $96,124 9,750 $ 12,071 9,722 11,183 32,976 23,537 6,199 11,110 73,822 897 4,009 64,194 (1,080) (16,165) (105,573) 100,239 Non- controlling Interest - 357 46,878 $120,700 $594 111 (2) $11,260 9,054 9,697 30,011 20,395 6,899 10,211 67,516 928 4,009 63,827 (1,146) (14,936) (100,406) 94,918 385 47,579 $115,095 Total Shareholders' Equity $55,778 9,861 (119) TOTAL LIABILITIES AND SHAREHOLDERS' EQUITY Consolidated Statements of Shareholders' Equity Dollars in millions except per share amounts; shares in thousands BALANCE JUNE 30, 2017 Net earnings Other comprehensive income/(loss) Dividends and dividend equivalents ($2.7860 per share): Common Preferred, net of tax benefits Treasury stock purchases Employee stock plans Preferred stock conversions ESOP debt impacts Noncontrolling interest, net. BALANCE JUNE 30, 2018 Impact of adoption of new accounting standards Net earnings Other comprehensive income/(loss) Dagdonde and decidand Common Stock Amount Shares 2,553,297 $4,009 (81,439) 21,655 4,580 2,498,093 $4,009 Preferred Stock $1,006 (39) $967 Additional Paid-In Capital $63,641 199 6 $63,846 Reserve for ESOP Debt Retirement ($1,249) 45 ($1,204) (326) 139 Accumulated Other Comprehensive Income/(Loss) Treasury Stock ($14,632) ($93,715) (117) ($14,749) (7,004) 1,469 33 ($99,217) (200) ANSWER 7 2 5 0 3 $4,009 4) Preferred Additional Reserve for ESOP Debt Retirement ($1,249) Amount Stock $4,009 $1,006 (39) $967 Paid-In Capital $63,641 199 6 $63,846 45 ($1,204) (326) 139 Accumulated Other Comprehensive Income/(Loss) Treasury Retained Stock Earnings ($14,632) ($93,715) $96,124 9,750 (117) ($14,749) (7,004) 1,469 33 ($99,217) (200) (5,003) (7,057) (265) 89 $98,641 (27) 3,897 (7,256) (263) Non- controlling Interest $594 111 (2) (113) $590 (553) 69 1 Total Shareholders' Equity $55,778 9,861 (119) (7,057) (265) (7,004) 1,668 134 $52,883 3,966 140 (7.256) (263) (5,003) Employee stock plans Preferred stock conversions ESOP debt impacts Noncontrolling interest, net BALANCE JUNE 30, 2019 Net earnings Other comprehensive income/(loss) Dividends and dividend equivalents ($3.0284 per share): Common Preferred, net of tax benefits Treasury stock purchases Employee stock plans Preferred stock conversions ESOP debt impacts Noncontrolling interest, net BALANCE JUNE 30, 2020 55,734 4,638 2,504,751 $4,009 (61,346) 32,603 3,738 2,479,746 $4,009 (39) $928 (31) $897 Consolidated Statements of Cash Flows Amounts in millions; Years ended June 30 CASH, CASH EQUIVALENTS AND RESTRICTED CASH, BEGINNING OF YEAR OPERATING ACTIVITIES Nat 93 6 (118) $63,827 362 5 $64,194 58 ($1,146) 66 ($1,080) 3,78 (1,229) 3 ($14,936) ($100,406 (7,405) 2,212 26 ($16,165) ($105,573) 55,734 4,638 04.751 $4,009 1,346) 32,603 3,738 79,746 $4,009 (39) $928 (31) $897 30 CTED CASH, BEGINNING OF YEAR 93 6 (118) $63,827 5 $64,194 58 ($1,146) 66 ($1,080) 3,781 33 (1,229) ($14,936) ($100,406) $94,918 13,027 (7,405) 2,212 26 ($16,165) ($105,573) 66 (7,551) (263) 108 $100,239 2020 $4,239 13,103 3,013 LEER (248) $385 76 (16) (88) $357 2019 $2,569 3,966 2,824 THE 2018 3,874 157 (366) $47,579 13,103 (1,245) (7,551) (263) (7,405) 2,574 174 (8) $46,878 $5,569 9,861 2,834 346 Jor Net earnings Depreciation and amortization Loss on early extinguishment of debt Share-based compensation expense Deferred income taxes $4,009 Consolidated Statements of Cash Flows Amounts in millions; Years ended June 30 CASH, CASH EQUIVALENTS AND RESTRICTED CASH, BEGINNING OF YEAR OPERATING ACTIVITIES Loss/(gain) on sale of assets Goodwill and indefinite-lived intangible impairment charges Change in accounts receivable Change in inventories Change in accounts payable, accrued and other liabilities Change in other operating assets and liabilities Other TOTAL OPERATING ACTIVITIES INVESTING ACTIVITIES Capital expenditures Proceeds from asset sales $897 Acquisitions, net of cash acquired Purchases of short-term investments Proceeds from sales and maturities of investment securities 2020 $ 4,239 13,103 3,013 - 558 (596) 7 - 634 (637) 1,923 (710) 108 17,403 (3,073) 30 (58) 6,151 (5) 3,045 ܝܝ (7,789) 2019 $2,569 3,966 2,824 515 (411) (678) 8,345 (276) (239) 1,856 (973) 313 15,242 (3,347) 394 (3,945) (158) 3,628 (62) (3,490) (7,498) ܘܘ 2018 $5,569 9,861 2,834 346 395 (1,844) (176) (177) (188) 1,385 2,000 431 14,867 (3,717) 269 (109) (3,909) 3,928 27 (3,511) (7,310) Other TOTAL OPERATING ACTIVITIES INVESTING ACTIVITIES Capital expenditures Proceeds from asset sales Acquisitions, net of cash acquired Purchases of short-term investments Proceeds from sales and maturities of investment securities Change in other investments TOTAL INVESTING ACTIVITIES FINANCING ACTIVITIES Dividends to shareholders i Increases/(reductions) in short-term debt Additions to long-term debt Reductions of long-term debt Treasury stock purchases Impact of stock options and other TOTAL FINANCING ACTIVITIES EFFECT OF EXCHANGE RATE CHANGES ON CASH, CASH EQUIVALENTS AND RESTRICTED CASH CHANGE IN CASH, CASH EQUIVALENTS AND RESTRICTED CASH CASH, CASH EQUIVALENTS AND RESTRICTED CASH, END OF YEAR SUPPLEMENTAL DISCLOSURE Cash payments for interest Cash payment for income taxes Assets acquired through non-cash finance leases are immaterial for all periods. Includes early outingui (710) 108 17,403 (3,073) 30 (58) - 6,151 (5) 3,045 (7,789) 2,345 4,951 (2,447) (7,405) 1,978 (8,367) (139) 11,942 $16,181 $434 3,550 (973) 313 15,242 (3,347) 394 (3,945) (158) 3,628 (62) (3,490) (7,498) (2,215) 2,367 (969) (5,003) 3,324 (9,994) (88) 1,670 $4,239 $497 3,064 2,000 431 14,867 (3,717) 269 (109) (3,909) 3,928 27 (3,511) (7,310) (3,437) 5,072 (2,873) (7,004) 1,177 (14,375) 19 (3,000) $ 2,569 $529 2,830 The financial statements of P&G are presented in Appendix B. The company's complete annual report, including the notes to the financial statements, is available online. Click here to view Appendix B. Refer to P&G's financial statements and the accompanying notes to answer the following questions. (c1) Compute P&G's gross profit for each of the years 2018-2020. (Enter amounts in million) Gross profit $ 2020 million 2019 million 2018 million Consolidated Statements of Earnings Amounts in millions except per share amounts; Years ended June 30 NET SALES Cost of products sold Selling, general and administrative expense Goodwill and indefinite-lived intangibles impairment charges OPERATING INCOME Interest expense Interest income Other non-operating income, net EARNINGS BEFORE INCOME TAXES Income taxes NET EARNINGS Less: Net earnings attributable to noncontrolling interests NET EARNINGS ATTRIBUTABLE TO PROCTER & GAMBLE¹ NET EARNINGS PER COMMON SHARE:² Basic Diluted 2020 $70,950 35,250 19,994 15,706 (465) 155 438 15,834 2,731 13,103 76 $13,027 $5.13 $4.96 2019 2020 $67,684 34,768 19,084 8,345 Gillette indefinite-lived intangible assets. 5,487 (509) 220 871 6,069 2,103 3,966 69 $3,897 $1.45 $1.43 $13,103 (1,083) (12) 2019 $3,966 (213) 184 2018 $66,832 34,432 19,037 13,363 (506) 247 222 13,326 3,465 9,861 111 9,750 $ 3.75 $3.67 2018 $9,861 (305) (148) Amounts in millions; Years ended June 30 NET EARNINGS Accounts receivable INVENTORIES Comprehensive Income OTHER COMPREHENSIVE INCOME/(LOSS), NET OF TAX Foreign currency translation (net of $59, $78 and $(279) tax, respectively) Unrealized gains/(losses) on investment securities (net of $(1), $0 and $0 tax, respectively) Unrealized gains/(losses) on defined benefit retirement plans (net of $(42), $22 and $68 tax, respectively) TOTAL OTHER COMPREHENSIVE INCOME/(LOSS), NET OF TAX TOTAL COMPREHENSIVE INCOME Less: Total comprehensive income attributable to noncontrolling interests TOTAL COMPREHENSIVE INCOME ATTRIBUTABLE TO PROCTER & GAMBLE Consolidated Balance Sheets Amounts in millions except stated values; As of June 30 Assets CURRENT ASSETS Cash and cash equivalents Available-for-sale investment securities Materials and supplies Work in process Finished goods uutav Total inventories Prepaid expenses and other current assets TOTAL CURRENT ASSETS PROPERTY DLANT AND EQUIPMENT NET 2020 $13,103 (1,083) (12) (150) (1,245) 11,858 60 $11,798 2020 2019 $3,966 (213) 184 169 140 4,106 70 $4,036 $ 16,181 - 4,178 1,414 674 3,410 5,498 2,130 27,987 20,692 39,901 23,792 8,328 $120.700 2019 2018 $9,861 (305) (148) 334 (119) 9,742 109 $9,633 $4,239 6,048 4,951 1,289 612 3,116 5,017 2,218 22,473 21,271 40,273 24,215 6,863 SL15095 Liabilities and Shareholders' Equity CURRENT LIABILITIES Accounts payable Accrued and other liabilities Debt due within one year TOTAL CURRENT LIABILITIES LONG-TERM DEBT DEFERRED INCOME TAXES OTHER NONCURRENT LIABILITIES TOTAL LIABILITIES SHAREHOLDERS' EQUITY Convertible Class A preferred stock, stated value $1 per share (600 shares authorized) Non-Voting Class B preferred stock, stated value $1 per share (200 shares authorized) Common stock, stated value $1 per share (10,000 shares authorized; shares issued: 2020-4,009.2, 2019-4,009.2) Additional paid-in capital Reserve for ESOP debt retirement Accumulated other comprehensive income/(loss) Treasury stock, at cost (shares held: 2020- 1,529.5, 2019 - 1,504.5) Retained earnings Noncontrolling interest TOTAL SHAREHOLDERS' EQUITY TOTAL LIABILITIES AND SHAREHOLDERS' EQUITY Consolidated Statements of Shareholders' Equity Acc 5) Retained Earnings $96,124 9,750 $ 12,071 9,722 11,183 32,976 23,537 6,199 11,110 73,822 897 4,009 64,194 (1,080) (16,165) (105,573) 100,239 Non- controlling Interest - 357 46,878 $120,700 $594 111 (2) $11,260 9,054 9,697 30,011 20,395 6,899 10,211 67,516 928 4,009 63,827 (1,146) (14,936) (100,406) 94,918 385 47,579 $115,095 Total Shareholders' Equity $55,778 9,861 (119) TOTAL LIABILITIES AND SHAREHOLDERS' EQUITY Consolidated Statements of Shareholders' Equity Dollars in millions except per share amounts; shares in thousands BALANCE JUNE 30, 2017 Net earnings Other comprehensive income/(loss) Dividends and dividend equivalents ($2.7860 per share): Common Preferred, net of tax benefits Treasury stock purchases Employee stock plans Preferred stock conversions ESOP debt impacts Noncontrolling interest, net. BALANCE JUNE 30, 2018 Impact of adoption of new accounting standards Net earnings Other comprehensive income/(loss) Dagdonde and decidand Common Stock Amount Shares 2,553,297 $4,009 (81,439) 21,655 4,580 2,498,093 $4,009 Preferred Stock $1,006 (39) $967 Additional Paid-In Capital $63,641 199 6 $63,846 Reserve for ESOP Debt Retirement ($1,249) 45 ($1,204) (326) 139 Accumulated Other Comprehensive Income/(Loss) Treasury Stock ($14,632) ($93,715) (117) ($14,749) (7,004) 1,469 33 ($99,217) (200) ANSWER 7 2 5 0 3 $4,009 4) Preferred Additional Reserve for ESOP Debt Retirement ($1,249) Amount Stock $4,009 $1,006 (39) $967 Paid-In Capital $63,641 199 6 $63,846 45 ($1,204) (326) 139 Accumulated Other Comprehensive Income/(Loss) Treasury Retained Stock Earnings ($14,632) ($93,715) $96,124 9,750 (117) ($14,749) (7,004) 1,469 33 ($99,217) (200) (5,003) (7,057) (265) 89 $98,641 (27) 3,897 (7,256) (263) Non- controlling Interest $594 111 (2) (113) $590 (553) 69 1 Total Shareholders' Equity $55,778 9,861 (119) (7,057) (265) (7,004) 1,668 134 $52,883 3,966 140 (7.256) (263) (5,003) Employee stock plans Preferred stock conversions ESOP debt impacts Noncontrolling interest, net BALANCE JUNE 30, 2019 Net earnings Other comprehensive income/(loss) Dividends and dividend equivalents ($3.0284 per share): Common Preferred, net of tax benefits Treasury stock purchases Employee stock plans Preferred stock conversions ESOP debt impacts Noncontrolling interest, net BALANCE JUNE 30, 2020 55,734 4,638 2,504,751 $4,009 (61,346) 32,603 3,738 2,479,746 $4,009 (39) $928 (31) $897 Consolidated Statements of Cash Flows Amounts in millions; Years ended June 30 CASH, CASH EQUIVALENTS AND RESTRICTED CASH, BEGINNING OF YEAR OPERATING ACTIVITIES Nat 93 6 (118) $63,827 362 5 $64,194 58 ($1,146) 66 ($1,080) 3,78 (1,229) 3 ($14,936) ($100,406 (7,405) 2,212 26 ($16,165) ($105,573) 55,734 4,638 04.751 $4,009 1,346) 32,603 3,738 79,746 $4,009 (39) $928 (31) $897 30 CTED CASH, BEGINNING OF YEAR 93 6 (118) $63,827 5 $64,194 58 ($1,146) 66 ($1,080) 3,781 33 (1,229) ($14,936) ($100,406) $94,918 13,027 (7,405) 2,212 26 ($16,165) ($105,573) 66 (7,551) (263) 108 $100,239 2020 $4,239 13,103 3,013 LEER (248) $385 76 (16) (88) $357 2019 $2,569 3,966 2,824 THE 2018 3,874 157 (366) $47,579 13,103 (1,245) (7,551) (263) (7,405) 2,574 174 (8) $46,878 $5,569 9,861 2,834 346 Jor Net earnings Depreciation and amortization Loss on early extinguishment of debt Share-based compensation expense Deferred income taxes $4,009 Consolidated Statements of Cash Flows Amounts in millions; Years ended June 30 CASH, CASH EQUIVALENTS AND RESTRICTED CASH, BEGINNING OF YEAR OPERATING ACTIVITIES Loss/(gain) on sale of assets Goodwill and indefinite-lived intangible impairment charges Change in accounts receivable Change in inventories Change in accounts payable, accrued and other liabilities Change in other operating assets and liabilities Other TOTAL OPERATING ACTIVITIES INVESTING ACTIVITIES Capital expenditures Proceeds from asset sales $897 Acquisitions, net of cash acquired Purchases of short-term investments Proceeds from sales and maturities of investment securities 2020 $ 4,239 13,103 3,013 - 558 (596) 7 - 634 (637) 1,923 (710) 108 17,403 (3,073) 30 (58) 6,151 (5) 3,045 ܝܝ (7,789) 2019 $2,569 3,966 2,824 515 (411) (678) 8,345 (276) (239) 1,856 (973) 313 15,242 (3,347) 394 (3,945) (158) 3,628 (62) (3,490) (7,498) ܘܘ 2018 $5,569 9,861 2,834 346 395 (1,844) (176) (177) (188) 1,385 2,000 431 14,867 (3,717) 269 (109) (3,909) 3,928 27 (3,511) (7,310) Other TOTAL OPERATING ACTIVITIES INVESTING ACTIVITIES Capital expenditures Proceeds from asset sales Acquisitions, net of cash acquired Purchases of short-term investments Proceeds from sales and maturities of investment securities Change in other investments TOTAL INVESTING ACTIVITIES FINANCING ACTIVITIES Dividends to shareholders i Increases/(reductions) in short-term debt Additions to long-term debt Reductions of long-term debt Treasury stock purchases Impact of stock options and other TOTAL FINANCING ACTIVITIES EFFECT OF EXCHANGE RATE CHANGES ON CASH, CASH EQUIVALENTS AND RESTRICTED CASH CHANGE IN CASH, CASH EQUIVALENTS AND RESTRICTED CASH CASH, CASH EQUIVALENTS AND RESTRICTED CASH, END OF YEAR SUPPLEMENTAL DISCLOSURE Cash payments for interest Cash payment for income taxes Assets acquired through non-cash finance leases are immaterial for all periods. Includes early outingui (710) 108 17,403 (3,073) 30 (58) - 6,151 (5) 3,045 (7,789) 2,345 4,951 (2,447) (7,405) 1,978 (8,367) (139) 11,942 $16,181 $434 3,550 (973) 313 15,242 (3,347) 394 (3,945) (158) 3,628 (62) (3,490) (7,498) (2,215) 2,367 (969) (5,003) 3,324 (9,994) (88) 1,670 $4,239 $497 3,064 2,000 431 14,867 (3,717) 269 (109) (3,909) 3,928 27 (3,511) (7,310) (3,437) 5,072 (2,873) (7,004) 1,177 (14,375) 19 (3,000) $ 2,569 $529 2,830 The financial statements of P&G are presented in Appendix B. The company's complete annual report, including the notes to the financial statements, is available online. Click here to view Appendix B. Refer to P&G's financial statements and the accompanying notes to answer the following questions. (c1) Compute P&G's gross profit for each of the years 2018-2020. (Enter amounts in million) Gross profit $ 2020 million 2019 million 2018 million Consolidated Statements of Earnings Amounts in millions except per share amounts; Years ended June 30 NET SALES Cost of products sold Selling, general and administrative expense Goodwill and indefinite-lived intangibles impairment charges OPERATING INCOME Interest expense Interest income Other non-operating income, net EARNINGS BEFORE INCOME TAXES Income taxes NET EARNINGS Less: Net earnings attributable to noncontrolling interests NET EARNINGS ATTRIBUTABLE TO PROCTER & GAMBLE¹ NET EARNINGS PER COMMON SHARE:² Basic Diluted 2020 $70,950 35,250 19,994 15,706 (465) 155 438 15,834 2,731 13,103 76 $13,027 $5.13 $4.96 2019 2020 $67,684 34,768 19,084 8,345 Gillette indefinite-lived intangible assets. 5,487 (509) 220 871 6,069 2,103 3,966 69 $3,897 $1.45 $1.43 $13,103 (1,083) (12) 2019 $3,966 (213) 184 2018 $66,832 34,432 19,037 13,363 (506) 247 222 13,326 3,465 9,861 111 9,750 $ 3.75 $3.67 2018 $9,861 (305) (148) Amounts in millions; Years ended June 30 NET EARNINGS Accounts receivable INVENTORIES Comprehensive Income OTHER COMPREHENSIVE INCOME/(LOSS), NET OF TAX Foreign currency translation (net of $59, $78 and $(279) tax, respectively) Unrealized gains/(losses) on investment securities (net of $(1), $0 and $0 tax, respectively) Unrealized gains/(losses) on defined benefit retirement plans (net of $(42), $22 and $68 tax, respectively) TOTAL OTHER COMPREHENSIVE INCOME/(LOSS), NET OF TAX TOTAL COMPREHENSIVE INCOME Less: Total comprehensive income attributable to noncontrolling interests TOTAL COMPREHENSIVE INCOME ATTRIBUTABLE TO PROCTER & GAMBLE Consolidated Balance Sheets Amounts in millions except stated values; As of June 30 Assets CURRENT ASSETS Cash and cash equivalents Available-for-sale investment securities Materials and supplies Work in process Finished goods uutav Total inventories Prepaid expenses and other current assets TOTAL CURRENT ASSETS PROPERTY DLANT AND EQUIPMENT NET 2020 $13,103 (1,083) (12) (150) (1,245) 11,858 60 $11,798 2020 2019 $3,966 (213) 184 169 140 4,106 70 $4,036 $ 16,181 - 4,178 1,414 674 3,410 5,498 2,130 27,987 20,692 39,901 23,792 8,328 $120.700 2019 2018 $9,861 (305) (148) 334 (119) 9,742 109 $9,633 $4,239 6,048 4,951 1,289 612 3,116 5,017 2,218 22,473 21,271 40,273 24,215 6,863 SL15095 Liabilities and Shareholders' Equity CURRENT LIABILITIES Accounts payable Accrued and other liabilities Debt due within one year TOTAL CURRENT LIABILITIES LONG-TERM DEBT DEFERRED INCOME TAXES OTHER NONCURRENT LIABILITIES TOTAL LIABILITIES SHAREHOLDERS' EQUITY Convertible Class A preferred stock, stated value $1 per share (600 shares authorized) Non-Voting Class B preferred stock, stated value $1 per share (200 shares authorized) Common stock, stated value $1 per share (10,000 shares authorized; shares issued: 2020-4,009.2, 2019-4,009.2) Additional paid-in capital Reserve for ESOP debt retirement Accumulated other comprehensive income/(loss) Treasury stock, at cost (shares held: 2020- 1,529.5, 2019 - 1,504.5) Retained earnings Noncontrolling interest TOTAL SHAREHOLDERS' EQUITY TOTAL LIABILITIES AND SHAREHOLDERS' EQUITY Consolidated Statements of Shareholders' Equity Acc 5) Retained Earnings $96,124 9,750 $ 12,071 9,722 11,183 32,976 23,537 6,199 11,110 73,822 897 4,009 64,194 (1,080) (16,165) (105,573) 100,239 Non- controlling Interest - 357 46,878 $120,700 $594 111 (2) $11,260 9,054 9,697 30,011 20,395 6,899 10,211 67,516 928 4,009 63,827 (1,146) (14,936) (100,406) 94,918 385 47,579 $115,095 Total Shareholders' Equity $55,778 9,861 (119) TOTAL LIABILITIES AND SHAREHOLDERS' EQUITY Consolidated Statements of Shareholders' Equity Dollars in millions except per share amounts; shares in thousands BALANCE JUNE 30, 2017 Net earnings Other comprehensive income/(loss) Dividends and dividend equivalents ($2.7860 per share): Common Preferred, net of tax benefits Treasury stock purchases Employee stock plans Preferred stock conversions ESOP debt impacts Noncontrolling interest, net. BALANCE JUNE 30, 2018 Impact of adoption of new accounting standards Net earnings Other comprehensive income/(loss) Dagdonde and decidand Common Stock Amount Shares 2,553,297 $4,009 (81,439) 21,655 4,580 2,498,093 $4,009 Preferred Stock $1,006 (39) $967 Additional Paid-In Capital $63,641 199 6 $63,846 Reserve for ESOP Debt Retirement ($1,249) 45 ($1,204) (326) 139 Accumulated Other Comprehensive Income/(Loss) Treasury Stock ($14,632) ($93,715) (117) ($14,749) (7,004) 1,469 33 ($99,217) (200) ANSWER 7 2 5 0 3 $4,009 4) Preferred Additional Reserve for ESOP Debt Retirement ($1,249) Amount Stock $4,009 $1,006 (39) $967 Paid-In Capital $63,641 199 6 $63,846 45 ($1,204) (326) 139 Accumulated Other Comprehensive Income/(Loss) Treasury Retained Stock Earnings ($14,632) ($93,715) $96,124 9,750 (117) ($14,749) (7,004) 1,469 33 ($99,217) (200) (5,003) (7,057) (265) 89 $98,641 (27) 3,897 (7,256) (263) Non- controlling Interest $594 111 (2) (113) $590 (553) 69 1 Total Shareholders' Equity $55,778 9,861 (119) (7,057) (265) (7,004) 1,668 134 $52,883 3,966 140 (7.256) (263) (5,003) Employee stock plans Preferred stock conversions ESOP debt impacts Noncontrolling interest, net BALANCE JUNE 30, 2019 Net earnings Other comprehensive income/(loss) Dividends and dividend equivalents ($3.0284 per share): Common Preferred, net of tax benefits Treasury stock purchases Employee stock plans Preferred stock conversions ESOP debt impacts Noncontrolling interest, net BALANCE JUNE 30, 2020 55,734 4,638 2,504,751 $4,009 (61,346) 32,603 3,738 2,479,746 $4,009 (39) $928 (31) $897 Consolidated Statements of Cash Flows Amounts in millions; Years ended June 30 CASH, CASH EQUIVALENTS AND RESTRICTED CASH, BEGINNING OF YEAR OPERATING ACTIVITIES Nat 93 6 (118) $63,827 362 5 $64,194 58 ($1,146) 66 ($1,080) 3,78 (1,229) 3 ($14,936) ($100,406 (7,405) 2,212 26 ($16,165) ($105,573) 55,734 4,638 04.751 $4,009 1,346) 32,603 3,738 79,746 $4,009 (39) $928 (31) $897 30 CTED CASH, BEGINNING OF YEAR 93 6 (118) $63,827 5 $64,194 58 ($1,146) 66 ($1,080) 3,781 33 (1,229) ($14,936) ($100,406) $94,918 13,027 (7,405) 2,212 26 ($16,165) ($105,573) 66 (7,551) (263) 108 $100,239 2020 $4,239 13,103 3,013 LEER (248) $385 76 (16) (88) $357 2019 $2,569 3,966 2,824 THE 2018 3,874 157 (366) $47,579 13,103 (1,245) (7,551) (263) (7,405) 2,574 174 (8) $46,878 $5,569 9,861 2,834 346 Jor Net earnings Depreciation and amortization Loss on early extinguishment of debt Share-based compensation expense Deferred income taxes $4,009 Consolidated Statements of Cash Flows Amounts in millions; Years ended June 30 CASH, CASH EQUIVALENTS AND RESTRICTED CASH, BEGINNING OF YEAR OPERATING ACTIVITIES Loss/(gain) on sale of assets Goodwill and indefinite-lived intangible impairment charges Change in accounts receivable Change in inventories Change in accounts payable, accrued and other liabilities Change in other operating assets and liabilities Other TOTAL OPERATING ACTIVITIES INVESTING ACTIVITIES Capital expenditures Proceeds from asset sales $897 Acquisitions, net of cash acquired Purchases of short-term investments Proceeds from sales and maturities of investment securities 2020 $ 4,239 13,103 3,013 - 558 (596) 7 - 634 (637) 1,923 (710) 108 17,403 (3,073) 30 (58) 6,151 (5) 3,045 ܝܝ (7,789) 2019 $2,569 3,966 2,824 515 (411) (678) 8,345 (276) (239) 1,856 (973) 313 15,242 (3,347) 394 (3,945) (158) 3,628 (62) (3,490) (7,498) ܘܘ 2018 $5,569 9,861 2,834 346 395 (1,844) (176) (177) (188) 1,385 2,000 431 14,867 (3,717) 269 (109) (3,909) 3,928 27 (3,511) (7,310) Other TOTAL OPERATING ACTIVITIES INVESTING ACTIVITIES Capital expenditures Proceeds from asset sales Acquisitions, net of cash acquired Purchases of short-term investments Proceeds from sales and maturities of investment securities Change in other investments TOTAL INVESTING ACTIVITIES FINANCING ACTIVITIES Dividends to shareholders i Increases/(reductions) in short-term debt Additions to long-term debt Reductions of long-term debt Treasury stock purchases Impact of stock options and other TOTAL FINANCING ACTIVITIES EFFECT OF EXCHANGE RATE CHANGES ON CASH, CASH EQUIVALENTS AND RESTRICTED CASH CHANGE IN CASH, CASH EQUIVALENTS AND RESTRICTED CASH CASH, CASH EQUIVALENTS AND RESTRICTED CASH, END OF YEAR SUPPLEMENTAL DISCLOSURE Cash payments for interest Cash payment for income taxes Assets acquired through non-cash finance leases are immaterial for all periods. Includes early outingui (710) 108 17,403 (3,073) 30 (58) - 6,151 (5) 3,045 (7,789) 2,345 4,951 (2,447) (7,405) 1,978 (8,367) (139) 11,942 $16,181 $434 3,550 (973) 313 15,242 (3,347) 394 (3,945) (158) 3,628 (62) (3,490) (7,498) (2,215) 2,367 (969) (5,003) 3,324 (9,994) (88) 1,670 $4,239 $497 3,064 2,000 431 14,867 (3,717) 269 (109) (3,909) 3,928 27 (3,511) (7,310) (3,437) 5,072 (2,873) (7,004) 1,177 (14,375) 19 (3,000) $ 2,569 $529 2,830
Expert Answer:

Related Book For 

Financial Accounting
ISBN: 978-1118978085
IFRS 3rd edition
Authors: Jerry J. Weygandt, Paul D. Kimmel, Donald E. Kieso
Posted Date:
Students also viewed these accounting questions
-
The financial statements of Louis Vuitton are presented in Appendix A. Instructions for accessing and using the companys complete annual report, including the notes to its financial statements, are...
-
The financial statements of PepsiCo, Inc., are presented in Appendix A at the end of this textbook. Instructions (a) What comments, if any, are made about cash in the report of the independent...
-
The financial statements of Tootsie Roll are presented in Appendix A at the end of this book. Instructions (a) Using the consolidated income statement and balance sheet, identify items that may...
-
In Exercises show that the function y = (x) is a solution of the differential equation. y = 4e-x y" - y = 0
-
What are common-size financial statements? What is their value to case analysis? How are they calculated?
-
The cumulative relative frequency graph shows the distribution of the percent of foreign-born residents in the 50 states. a. Estimate the interquartile range (IQR) of this distribution. Show your...
-
Football and Cognitive Percentile Exercise 2.143 on page 102 introduces a study that examines several variables on collegiate football players, including the variable Years, which is number of years...
-
Unter Components manufactures low-cost navigation systems for installation in ride-sharing cars. It sells these systems to various car services that can customize them for their locale and business...
-
Explain Australia Comoany act 2 0 0 1 registed scheme in details.
-
Please review the State of West Virginia v. Keith O. Peoples case and respond to the following challenges: 1. The charge against Peoples was fraud, a criminal offense. Compare and contrast a criminal...
-
You have a tract of land on which trees can be grown. The initial cost of planting the trees is Rs 80,000. The net revenue realisable from the harvesting of trees would be as follows: The opportunity...
-
When demand is relatively inelastic and supply is relatively elastic, the burden of a tax will be borne ______. a) mainly by sellers b) mainly by buyers c) equally between sellers and buyers d) it is...
-
If a monopolist has a straight-line demand curve, its marginal revenue curve ___________. a) will be the same as the demand curve b) will fall twice as quickly as the demand curve c) will lie below...
-
Which statement is the most accurate ? a) The demand for gasoline is very elastic. b) The demand for home heating oil is very inelastic. c) The seller of a perishable commodity has a relatively...
-
The monopolist produces _____. a) where MC equals MR b) at the minimum point of ATC c) at maximum output d) when price is highest.
-
The monopolists demand and marginal revenue curves ___________. a) are exactly the same b) are completely different c) coincide only at one unit of output d) cross.
-
Let A, B be m x n matrices over a field F such that their reduced row- echelon forms are the same. What can we say about the relationship between the nullspace N(A) N(LA) of A and the nullspace N(B)...
-
Identify one local business that uses a perpetual inventory system and another that uses a periodic system. Interview an individual in each organization who is familiar with the inventory system and...
-
The financial statements of TSMC appear in Appendix A. The notes to consolidated financial statements appear in the 2013 annual report, which can be found in the Investors section of the company's...
-
Before the final distribution of cash, account balances are Cash 25,000; B. Remington, Capital 19,000 (Cr.); L. Seastrom, Capital 12,000 (Cr.); and T. Luthi, Capital 6,000 (Dr.). Luthi is unable to...
-
Part 1 Mei-ling is struggling to keep up with the recording of her accounting transactions. She is spending a lot of time marketing and selling mixers and giving her cookie classes. Her friend Mike...
-
Which managerial skill refers to the ability to view the entire situation in totality? Technical skills Human skills Conceptual skills None of the above
-
Which level of management includes departmental managers, deputy managers, and assistant managers? Strategic-level management Middle-level management Operative-level management None of the above
-
Which objective of management takes care of the conservation of the environment and natural resources? Organizational objectives Personal objectives Social objectives None of the above

Study smarter with the SolutionInn App