

Question: The first attachment gives the summation. Using Matlab, create a plot for temperature u as a function of time t and distance x on a
The first attachment gives the summation. Using Matlab, create a plot for temperature u as a function of time t and distance x on a surface in 3-dimensional space. The simulation should be run until the variation of temperature is less than 0.1 along the rod.
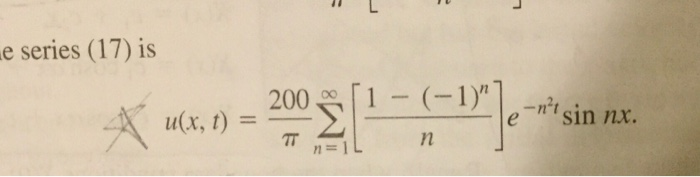
e series (17) is It(x, t) = 2005 [1-(-1)"Ie-ri [1-(-1)" 200 u(x, t) = e"sin nx. - n=IL
Step by Step Solution
There are 3 Steps involved in it
1 Expert Approved Answer
Step: 1 Unlock

Question Has Been Solved by an Expert!
Get step-by-step solutions from verified subject matter experts
Step: 2 Unlock
Step: 3 Unlock