

Question: The flow chart image below illustrates the process flow describing the experiences captured by the interview experiences from women shopping. The visualization of a qualitative
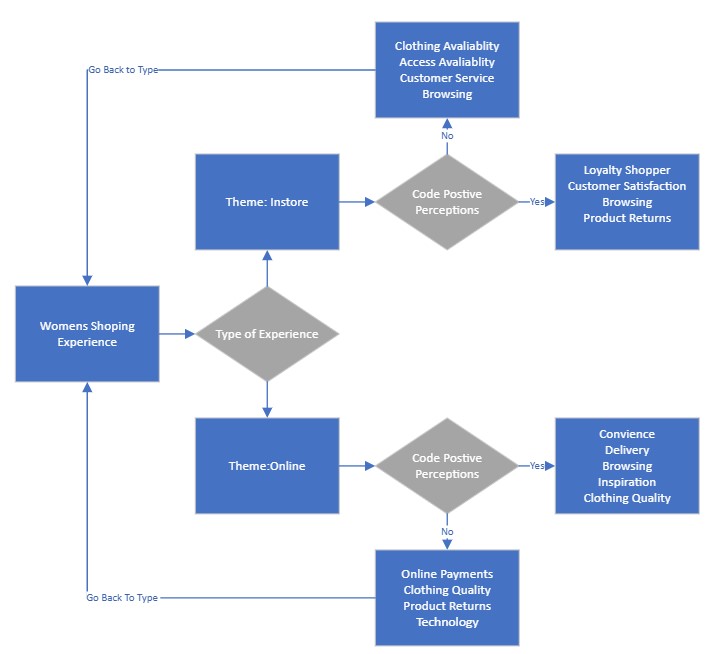
The flow chart image below illustrates the process flow describing the experiences captured by the interview experiences from women shopping. The visualization of a qualitative study illustrates how the researcher views the study. The qualitative collection of women's shopping experiences outlined two types of shopping experiences an in-store experience and an online experience. The perceptions of experiences were coded by positive perceptions of the experience and negative perceptions of the experiences. According to our weekly reading, subject code networks are thoughts expressed, and in this study, the researcher asked about the experience on the topic (Pokorny et al., 2018). The illustration below provides the subject and code networks expressed throughout the study.
The CAQDAS collected the sentiment trends as the rationale behind the graphic. The process of perceptions illustrates what areas identified a positive and/or negative experience.
Comment on the post and ask question?
Clothing Avaliablity Access Avaliablity Customer Service Browsing Go Back to Type Loyalty Shopper Theme: Instore Womens Shoping Experience Code Postive Perceptions Customer Satisfaction Browsing Product Returns Go Back To Type Type of Experience Code Postive Perceptions Yes Online Payments Clothing Quality Product Returns Technology Convience Delivery Browsing Inspiration Clothing Quality
Step by Step Solution
There are 3 Steps involved in it

Get step-by-step solutions from verified subject matter experts