

Question: The flow chart shown above depicts a general manufacturing process. The capacity of each station in gal/hr is shown in each box as a number
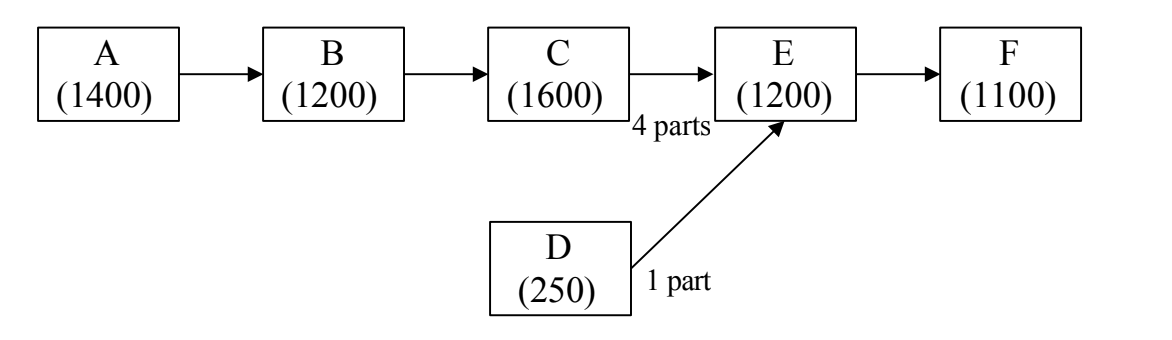
The flow chart shown above depicts a general manufacturing process. The capacity of each station in gal/hr is shown in each box as a number in parentheses. (a) What is the system capacity? Please show your work. (3 pt) (b) What is the utilization at each station? (6 pts) (c) Where is the bottleneck in this system? (1 pt)
Step by Step Solution
There are 3 Steps involved in it
1 Expert Approved Answer
Step: 1 Unlock

Question Has Been Solved by an Expert!
Get step-by-step solutions from verified subject matter experts
Step: 2 Unlock
Step: 3 Unlock