

Question: The flow chart shown above depicts a general manufacturing process. The capacity of each station in gal /hr is shown in each box as a
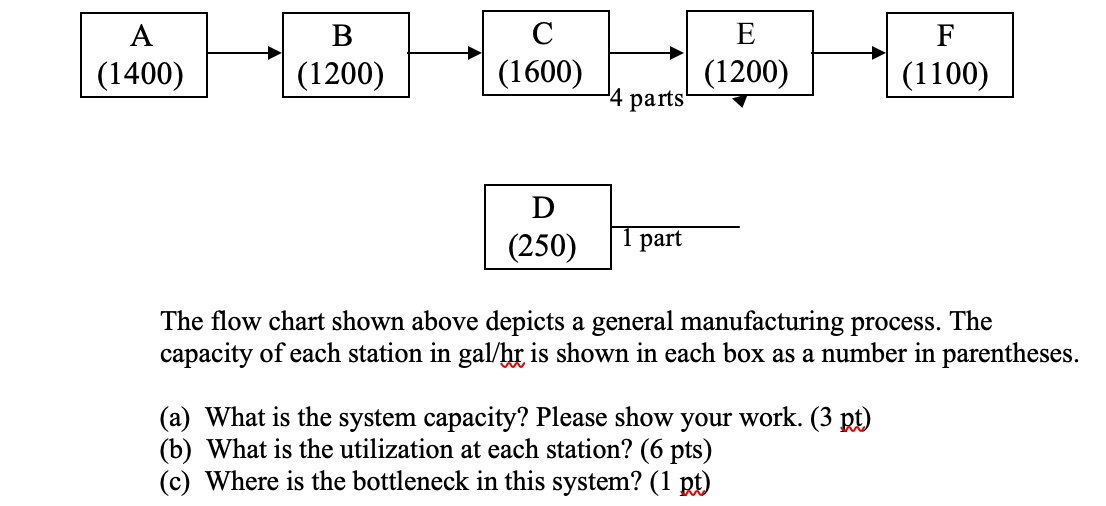
The flow chart shown above depicts a general manufacturing process. The capacity of each station in gal /hr is shown in each box as a number in parentheses. (a) What is the system capacity? Please show your work. ( 3pt ) (b) What is the utilization at each station? (6 pts) (c) Where is the bottleneck in this system? (1 pt)
Step by Step Solution
There are 3 Steps involved in it
1 Expert Approved Answer
Step: 1 Unlock

Question Has Been Solved by an Expert!
Get step-by-step solutions from verified subject matter experts
Step: 2 Unlock
Step: 3 Unlock