

Question: the flow chart You are working as a teaching assistant at a local university, you gave your students three exams: in math, science, and stem.
 the flow chart
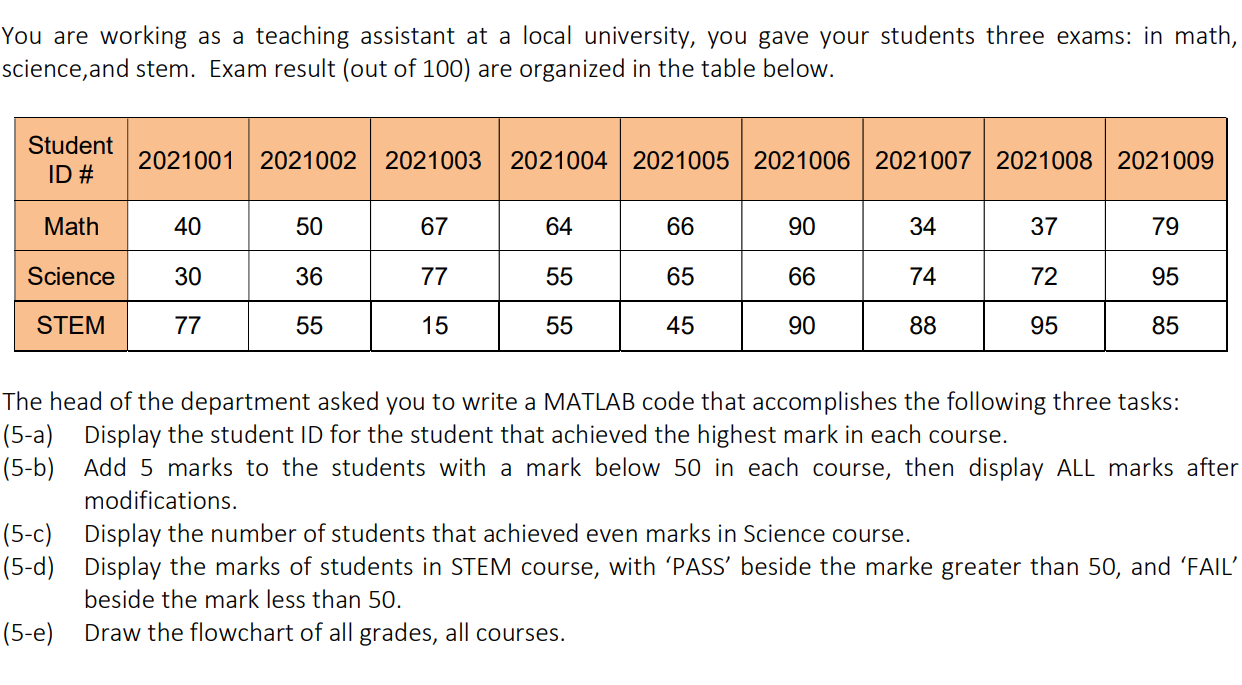
You are working as a teaching assistant at a local university, you gave your students three exams: in math, science, and stem. Exam result (out of 100) are organized in the table below. Student ID # 2021001 2021002 2021003 2021004 2021005 2021006 2021007 2021008 2021009 Math 40 50 67 64 66 90 34 37 79 Science 30 36 77 55 65 66 74 72 95 STEM 77 55 15 55 45 90 88 95 85 The head of the department asked you to write a MATLAB code that accomplishes the following three tasks: (5-a) Display the student ID for the student that achieved the highest mark in each course. (5-b) Add 5 marks to the students with a mark below 50 in each course, then display ALL marks after modifications. (5-0) Display the number of students that achieved even marks in Science course. (5-d) Display the marks of students in STEM course, with PASS' beside the marke greater than 50, and 'FAIL beside the mark less than 50. (5-e) Draw the flowchart of all grades, all courses
Step by Step Solution
There are 3 Steps involved in it

Get step-by-step solutions from verified subject matter experts