

Question: The following ACF plot shows the sample autocorrelations, ,, up to lag 10, for the residuals of an ARIMA model fit. The heights of the

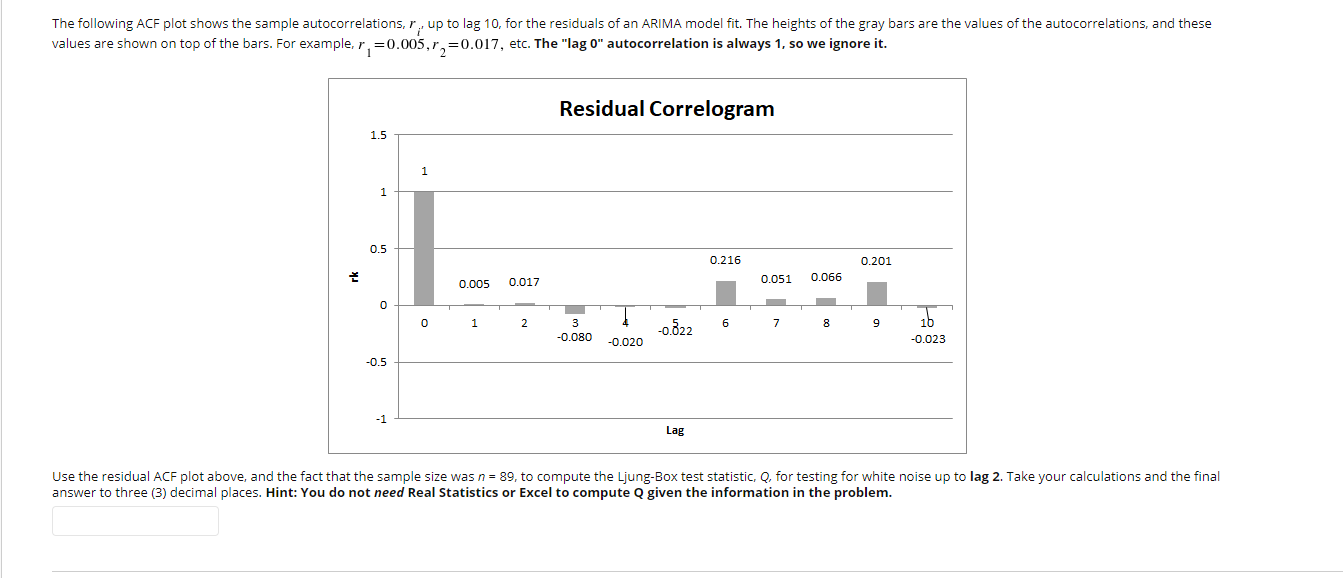
The following ACF plot shows the sample autocorrelations, ,, up to lag 10, for the residuals of an ARIMA model fit. The heights of the gray bars are the values of the autocorrelations, and these values are shown on top of the bars. For example, r =0.005, r, =0.017, etc. The "lag 0" autocorrelation is always 1, so we ignore it. Residual Correlogram 1.5 1 1 0.5 0.216 0.201 0.017 0.051 0.066 0.005 0 1 2 3 -0.080 -0.822 6 7 9 1b -0.020 -0.023 0.5 -1 Lag Use the residual ACF plot above, and the fact that the sample size was n = 89, to compute the Ljung-Box test statistic, Q, for testing for white noise up to lag 2. Take your calculations and the final answer to three (3) decimal places. Hint: You do not need Real Statistics or Excel to compute Q given the information in the
Step by Step Solution
There are 3 Steps involved in it

Get step-by-step solutions from verified subject matter experts