

Question: The following bar graph presents the average amount a U.S. family spent, in dollars, on various food categories in a recent year. 1100- 1000- 900-
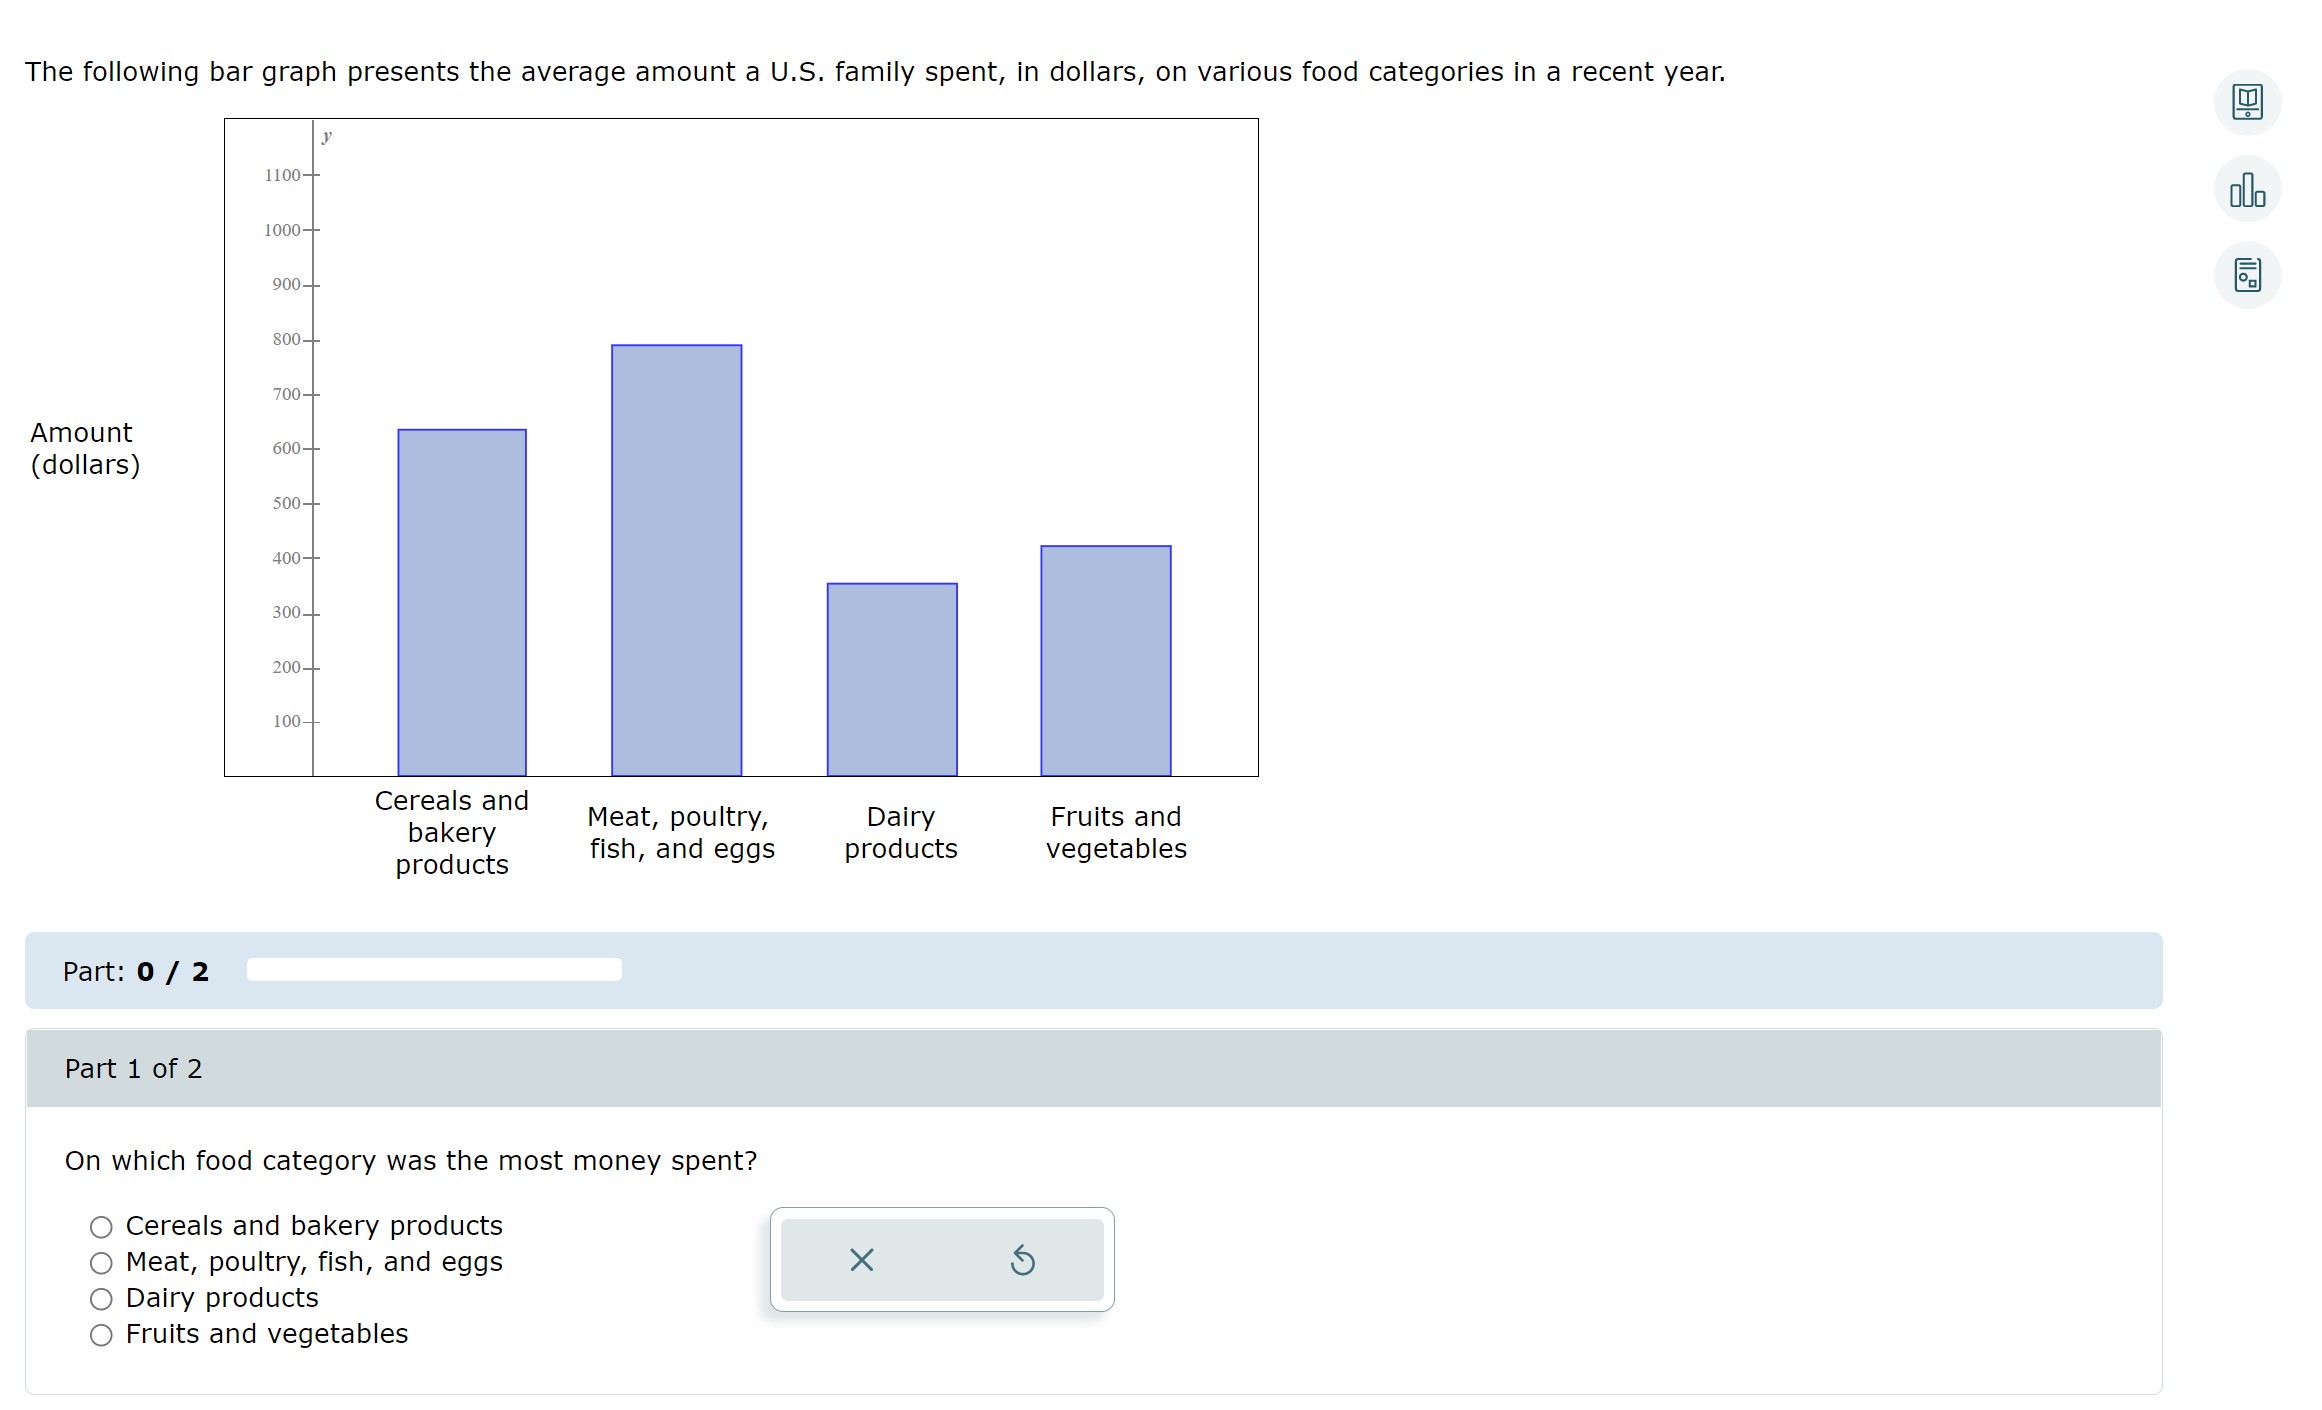

The following bar graph presents the average amount a U.S. family spent, in dollars, on various food categories in a recent year. 1100- 1000- 900- 800- 700- Amount 600- (dollars) 500- 400- 300- 200- 100- Cereals and bakery Meat, poultry, Dairy Fruits and products fish, and eggs products vegetables Part: 0 / 2 Part 1 of 2 On which food category was the most money spent? Cereals and bakery products O Meat, poultry, fish, and eggs X Dairy products O Fruits and vegetables
Step by Step Solution
There are 3 Steps involved in it
1 Expert Approved Answer
Step: 1 Unlock

Question Has Been Solved by an Expert!
Get step-by-step solutions from verified subject matter experts
Step: 2 Unlock
Step: 3 Unlock