

Question: The following chart is reproduced from the 2016 document Why Australia: Benchmark Report 2016 prepared by Australian Trade Commission, Australian Government. a. Discuss the purpose
The following chart is reproduced from the 2016 document "Why Australia: Benchmark Report 2016" prepared by Australian Trade Commission, Australian Government. a. Discuss the purpose of chart 1 and critically assess how well it meets this purpose. b. How would you change the graph if it were for a technical audience? Chart 1: Australia - Partner for Growth in Asia Australia's top 10 goods and services exporting markets were in the Asian region in 2014
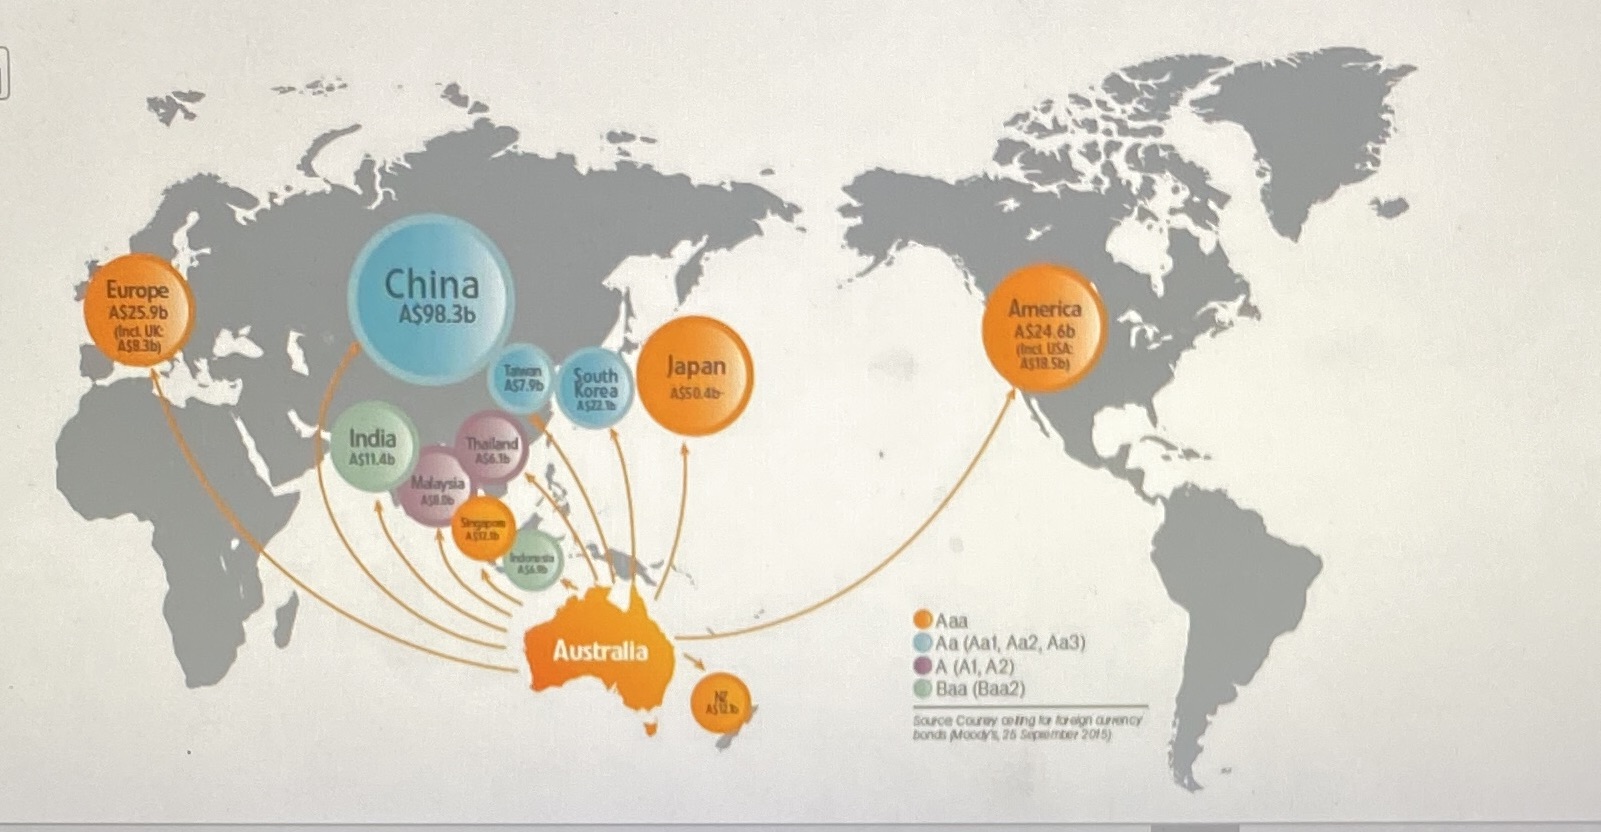
Europe China AS25.9b A$98.3b America A$24.6b A59 3b) (lect USA A518 56) A57.9b South Japan Korea A$50.4b ASzz. In India Thailand AS114b AS6.16 Malaysia Aaa Australia Aa (Aat, Aa2, Aa3) OA (A1, A2) Baa (Baa2) Source Courey cling to tor sign currency bonds Moody's, 25 Sixmember 2015)
Step by Step Solution
There are 3 Steps involved in it

Get step-by-step solutions from verified subject matter experts