

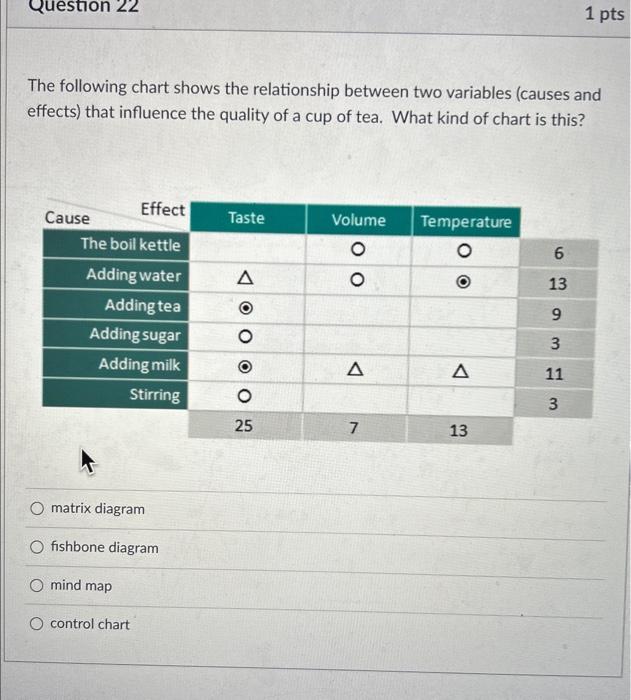
Question: The following chart shows the relationship between two variables (causes and effects) that influence the quality of a cup of tea. What kind of chart
Step by Step Solution
There are 3 Steps involved in it
1 Expert Approved Answer
Step: 1 Unlock

Question Has Been Solved by an Expert!
Get step-by-step solutions from verified subject matter experts
Step: 2 Unlock
Step: 3 Unlock