

Question: The following contingency table was generated using partial survival status data from the 1912 Titanic ocean liner disaster. Survival Status First Class Second Class Third
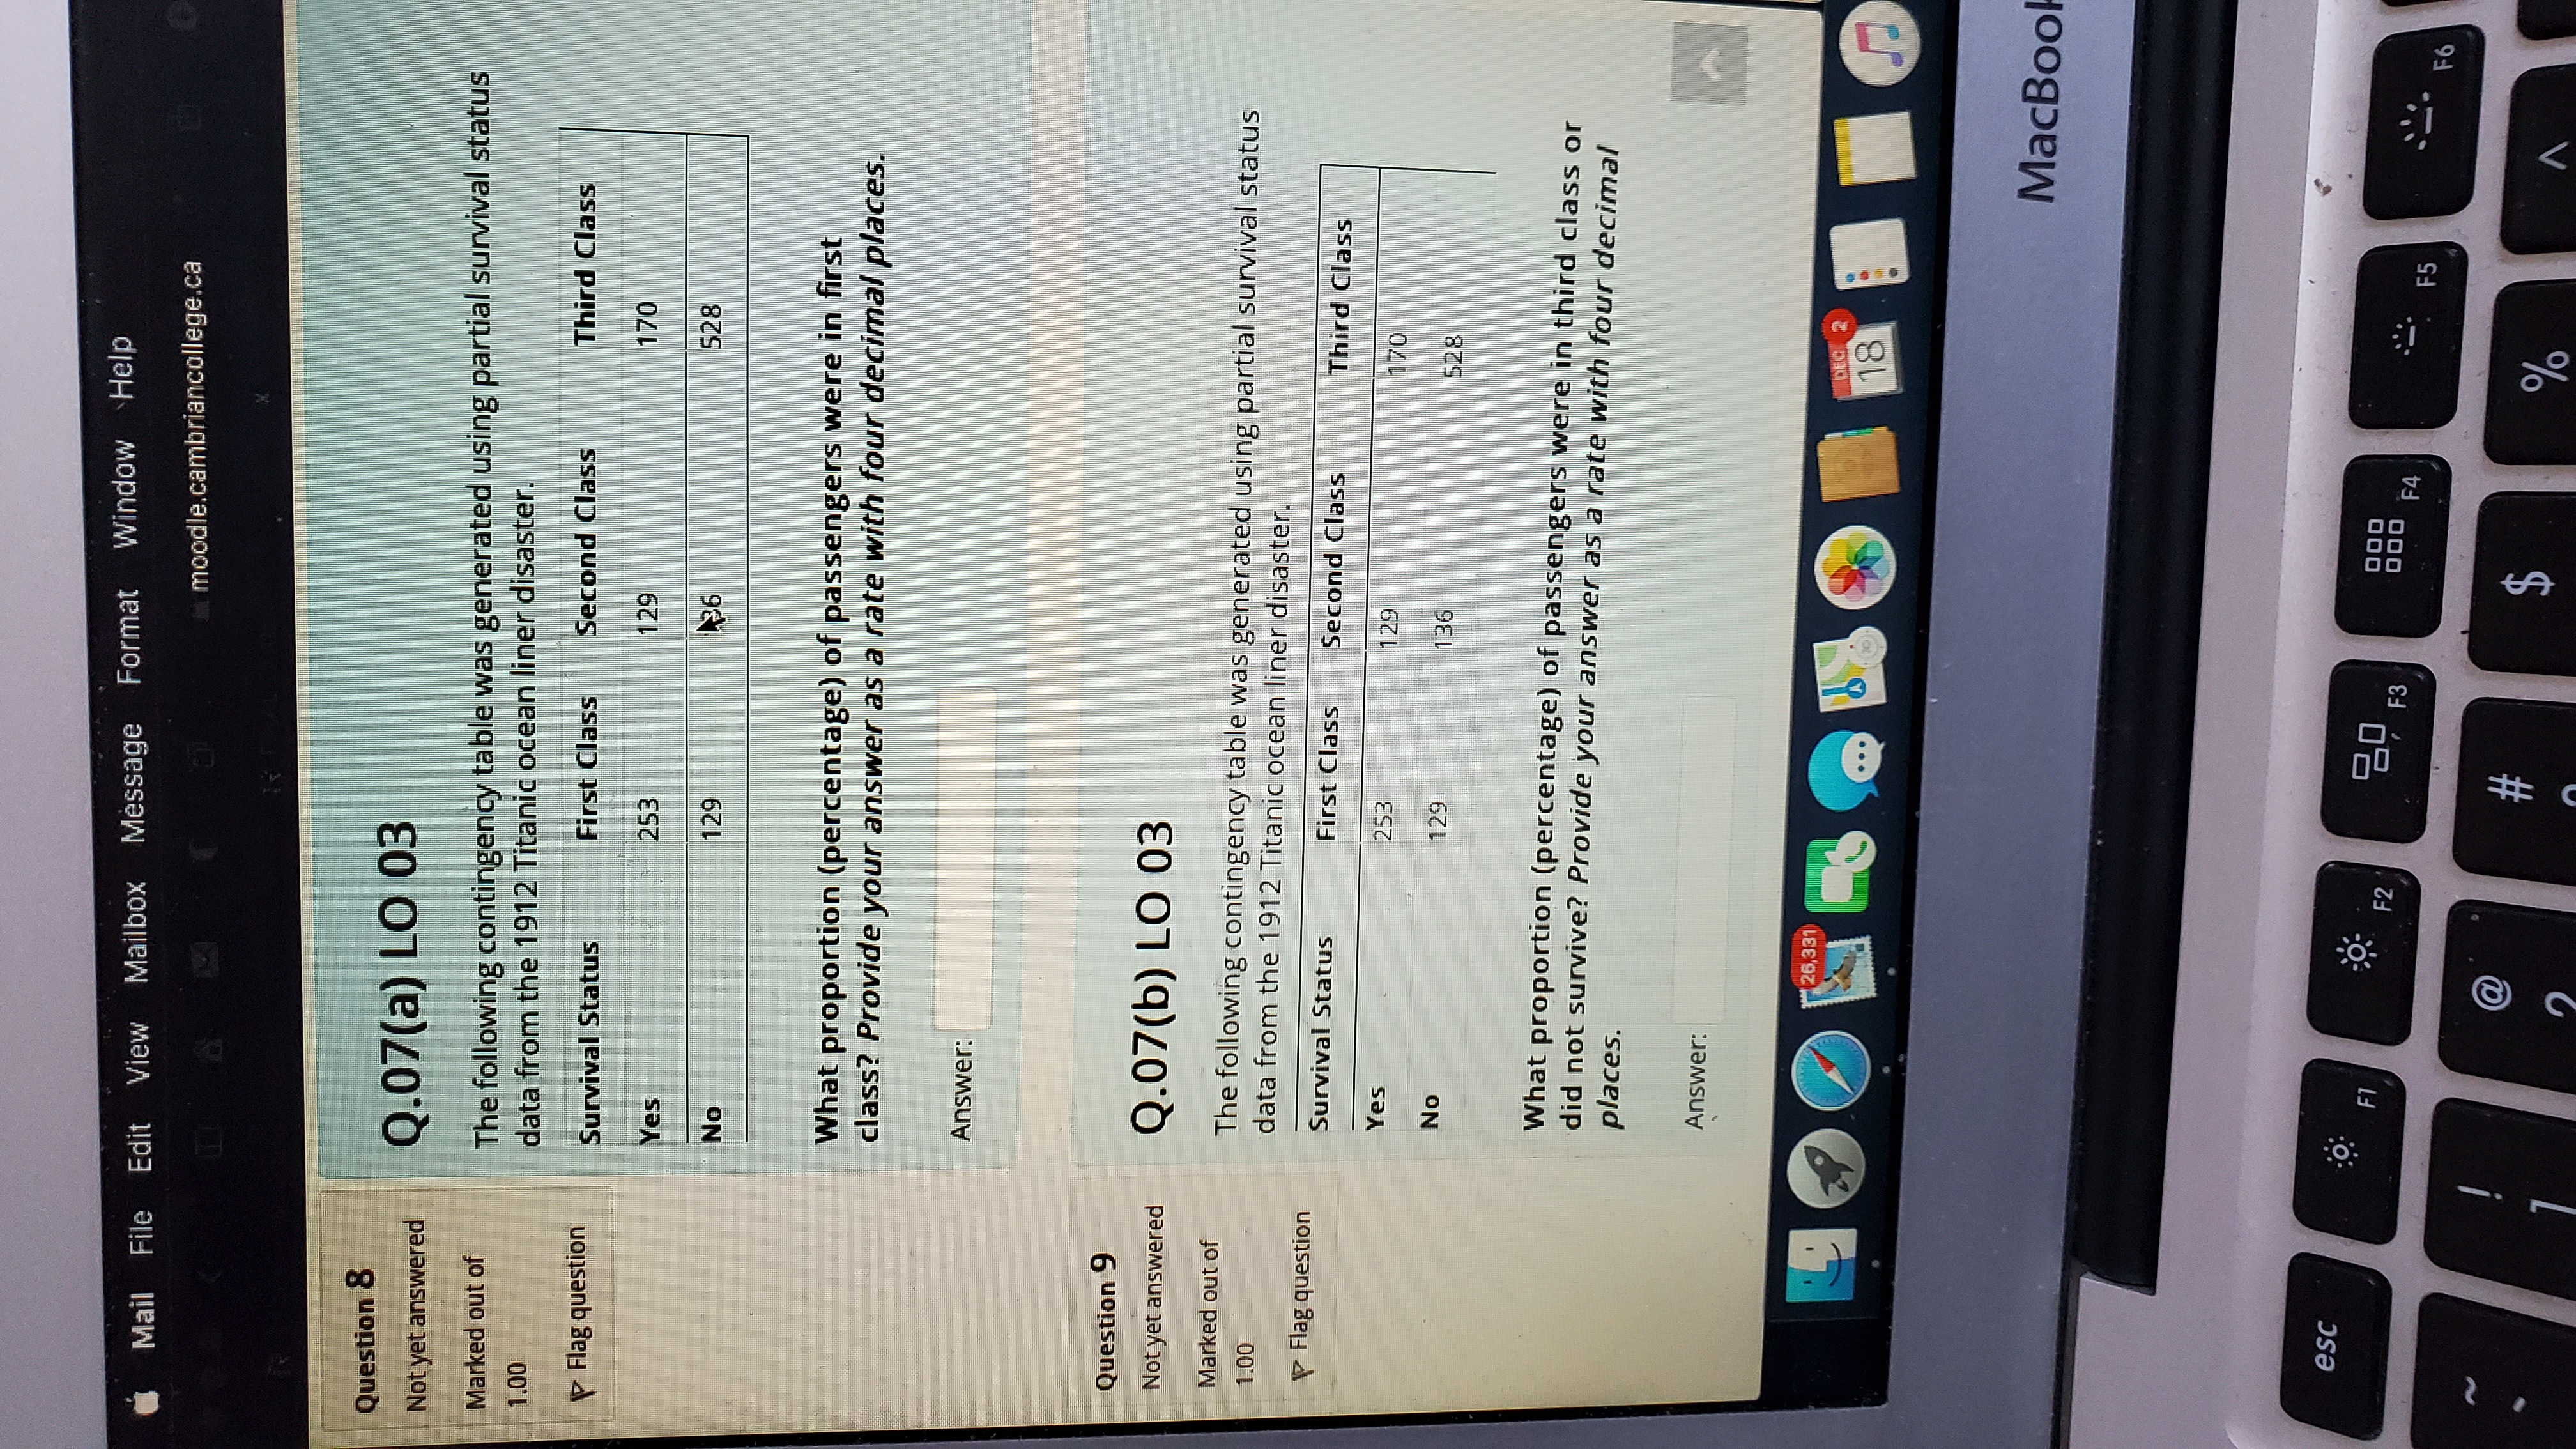
The following contingency table was generated using partial survival status data from the 1912 Titanic ocean liner disaster.
Survival Status
First Class
Second Class
Third Class
Yes
253
129
170
No
129
136
528
What proportion (percentage) of passengers were in first class?Provide your answer as a rate with four decimal places.
full question is uploaded as picture
Mail File Edit View Mailbox Message Format Window Help moodle.cambriancollege.ca Question 8 Not yet answered Q.07(a) LO 03 Marked out of The following contingency table was generated using partial survival status 1.00 data from the 1912 Titanic ocean liner disaster. Flag question Survival Status First Class Second Class Third Class Yes 253 129 170 No 129 436 528 What proportion (percentage) of passengers were in first class? Provide your answer as a rate with four decimal places. Answer: Question 9 Not yet answered Q.07(b) LO 03 Marked out of 1.00 The following contingency table was generated using partial survival status data from the 1912 Titanic ocean liner disaster. Flag question Survival Status First Class Second Class Third Class Yes 253 129 170 No 129 136 528 What proportion (percentage) of passengers were in third class or did not survive? Provide your answer as a rate with four decimal places. Answer: 26,331 DEC 2 18 MacBool esc F1 F2 20 F3 F4 F5 F6 a to % A
Step by Step Solution
There are 3 Steps involved in it

Get step-by-step solutions from verified subject matter experts