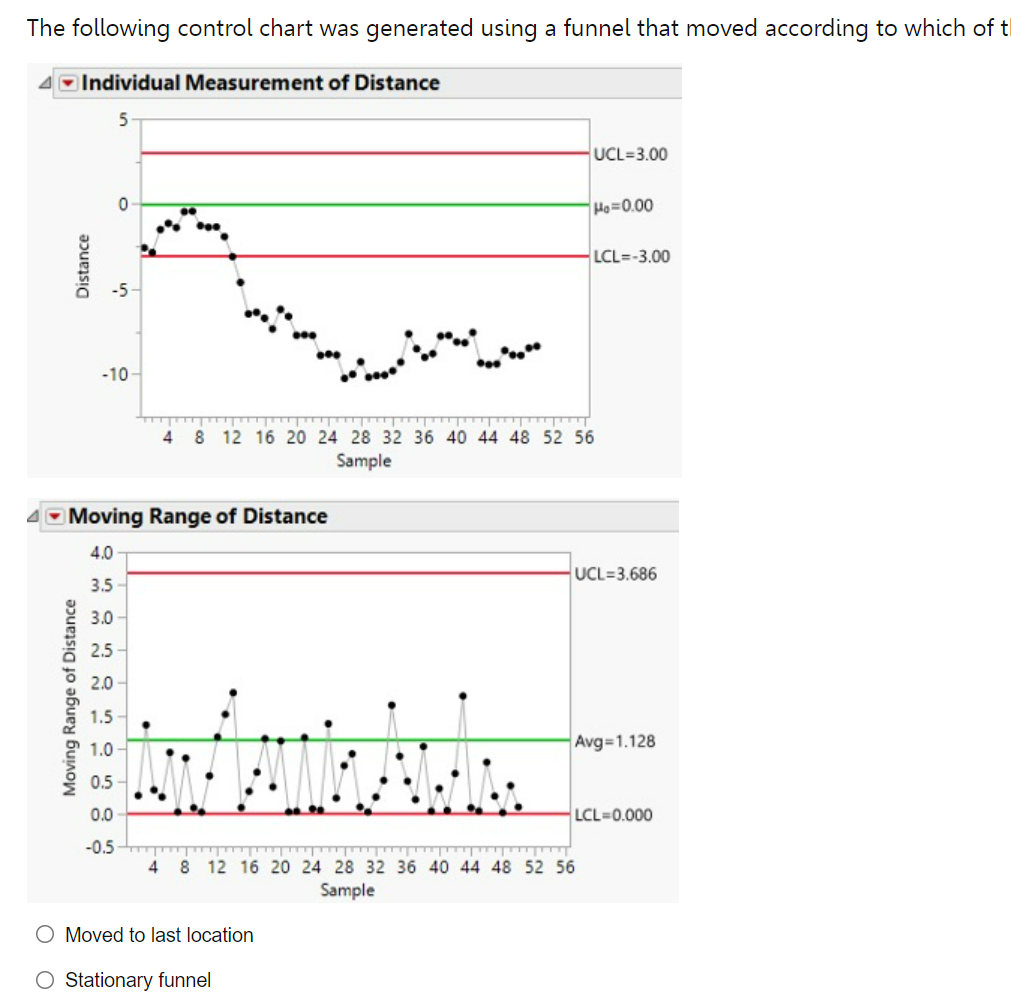
Question: The following control chart was generated using a funnel that moved according to which of t 4 Individual Measurement of Distance 5 UCL=3.00 0 0

The following control chart was generated using a

The following control chart was generated using a funnel that moved according to which of t 4 Individual Measurement of Distance 5 UCL=3.00 0 0 He=0.00 LCL-3.00 Distance . -10 4 8 12 16 20 24 28 32 36 40 44 48 52 56 Sample Moving Range of Distance 4.0 UCL=3.686 3.5 3.0 2.5 2.0 Moving Range of Distance 1.5 1.0 Avg=1.128 I. 0.5 0.0 LCL=0.000 -0.5 4 8 12 16 20 24 28 32 36 40 44 48 52 56 Sample O Moved to last location O Stationary funnel

Step by Step Solution

There are 3 Steps involved in it

1 Expert Approved Answer
Step: 1 Unlock blur-text-image
Question Has Been Solved by an Expert!

Get step-by-step solutions from verified subject matter experts

Step: 2 Unlock
Step: 3 Unlock

Students Have Also Explored These Related General Management Questions!