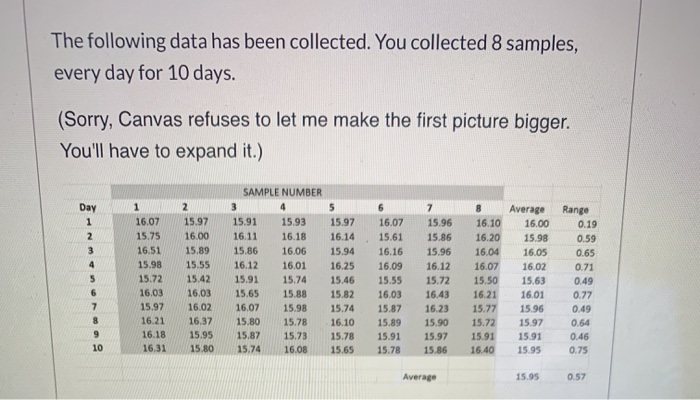
Question: The following data has been collected. You collected 8 samples, every day for 10 days. (Sorry, Canvas refuses to let me make the first picture

The following data has been collected. You
The following data has been collected. You collected 8 samples, every day for 10 days. (Sorry, Canvas refuses to let me make the first picture bigger. You'll have to expand it.) SAMPLE NUMBER Day Average 16.00 15.98 16.05 16.02 15.63 Range 0.19 0.59 16.07 15.75 16.51 15.98 15.72 16.03 15.97 16.21 16.18 16.31 0.65 15.97 16.00 15.89 15.55 15.42 16.03 16.02 16.37 15.95 15.80 1 5.91 16.11 15.86 16.12 15.91 15.65 16.07 15.80 15.87 15.74 15.93 16.18 16.06 16.01 15.74 15.88 15.98 15.78 15.73 16.08 15.97 16.14 15.94 16.25 15.46 15.82 15.74 16.10 15.78 15.65 16.07 15.61 16.16 16.09 15.55 16.03 15.87 15.89 15.91 15.78 1 5.96 15.86 15.96 16.12 15.72 16.43 16.23 15.90 15.97 15.86 16.10 16.20 16.04 16.07 15.50 16.21 15.77 15.72 15.91 16.40 16.01 15.96 15.97 15.91 15.95 0.71 0.49 0.27 0.49 0.64 0.46 0.75 Average 15.95 0:57 Control chart factors: Sample Size (n) A2 1.88 1.02 0.73 0.58 0.48 0.42 0.37 0.34 0.31 D4 3.27 2.57 2.28 2.11 2.00 1.92 1.86 1.82 1.78 0 0.08 0.14 0.18 0.22 10 a. What control chart factor value from the above table would you use to construct an X-bar chart? b. What control chart factor values from the above table would you use to construct an R-chart? YOU DO NOT HAVE TO CALCULATE ANY CONTROL LIMIT VALUES ON THIS PROBLEM!!!!! Just tell me which numbers from the bottom table you would use, if you computing the control limits

Step by Step Solution

There are 3 Steps involved in it

1 Expert Approved Answer
Step: 1 Unlock blur-text-image
Question Has Been Solved by an Expert!

Get step-by-step solutions from verified subject matter experts

Step: 2 Unlock
Step: 3 Unlock

Students Have Also Explored These Related General Management Questions!