

Question: The following data has been collected. You collected 8 samples, every day for 10 days. (Sorry, Canvas refuses to let me make the first picture
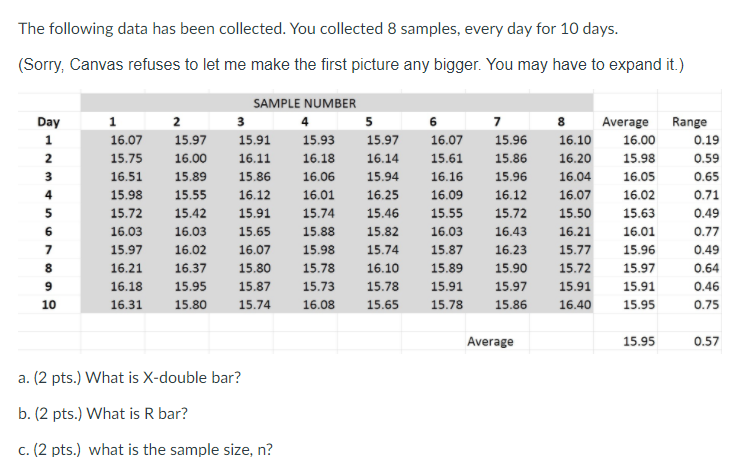
The following data has been collected. You collected 8 samples, every day for 10 days. (Sorry, Canvas refuses to let me make the first picture any bigger. You may have to expand it.) Day 1 2 3 4 5 6 7 8 9 10 1 16.07 15.75 16.51 15.98 15.72 16.03 15.97 16.21 16.18 16.31 2 15.97 16.00 15.89 15.55 15.42 16.03 16.02 16.37 15.95 15.80 SAMPLE NUMBER 3 4 15.91 15.93 16.11 16.18 15.86 16.06 16.12 16.01 15.91 15.74 15.65 15.88 16.07 15.98 15.80 15.78 15.87 15.73 15.74 16.08 5 15.97 16.14 15.94 16.25 15.46 15.82 15.74 16.10 15.78 15.65 6 16.07 15.61 16.16 16.09 15.55 16.03 15.87 15.89 15.91 15.78 7 15.96 15.86 15.96 16.12 15.72 16.43 16.23 15.90 15.97 15.86 8 16.10 16.20 16.04 16.07 15.50 16.21 15.77 15.72 15.91 16.40 Average 16.00 15.98 16.05 16.02 15.63 16.01 15.96 15.97 15.91 15.95 Range 0.19 0.59 0.65 0.71 0.49 77 0.49 0.64 0.46 0.75 Average 15.95 0.57 a. (2 pts. What is X-double bar? b. (2 pts. What is R bar? C. (2 pts.) what is the sample size, n
Step by Step Solution
There are 3 Steps involved in it
1 Expert Approved Answer
Step: 1 Unlock

Question Has Been Solved by an Expert!
Get step-by-step solutions from verified subject matter experts
Step: 2 Unlock
Step: 3 Unlock