Answered step by step
Verified Expert Solution
Question
1 Approved Answer
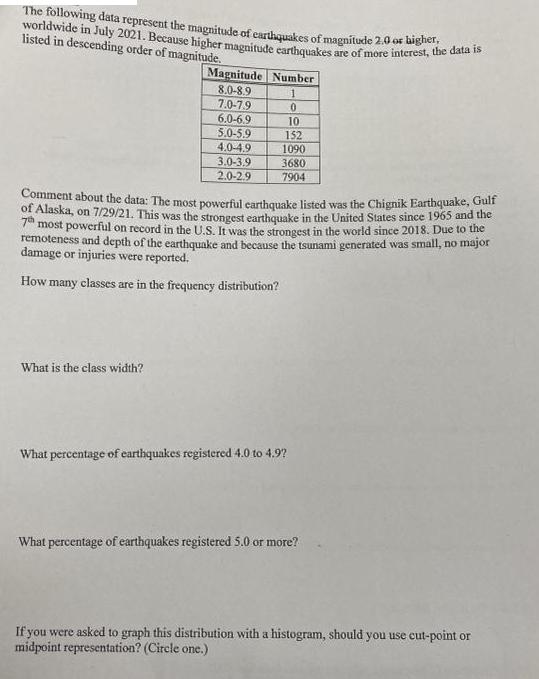
The following data represent the magnitude of carthquakes of magnitude 2.0 or high, the worldwide in July 2021. Because higher magnitude earthquakes are of

The following data represent the magnitude of carthquakes of magnitude 2.0 or high, the worldwide in July 2021. Because higher magnitude earthquakes are of more interest, the data is listed in descending order of magnitude. Magnitude Number 8.0-8.9 1 7.0-7.9 0 6.0-6.9 10 5.0-5.9 152 4.0-4.9 1090 3.0-3.9 3680 2.0-2.9 7904 Comment about the data: The most powerful earthquake listed was the Chignik Earthquake, Gulf of Alaska, on 7/29/21. This was the strongest earthquake in the United States since 1965 and the 7th most powerful on record in the U.S. It was the strongest in world since 2018. Due to the remoteness and depth of the earthquake and because the tsunami generated was small, no major damage or injuries were reported. How many classes are in the frequency distribution? What is the class width? What percentage of earthquakes registered 4.0 to 4.9? What percentage of earthquakes registered 5.0 or more? If you were asked to graph this distribution with a histogram, should you use cut-point or midpoint representation? (Circle one.)
Step by Step Solution
★★★★★
3.42 Rating (158 Votes )
There are 3 Steps involved in it
Step: 1

Get Instant Access to Expert-Tailored Solutions
See step-by-step solutions with expert insights and AI powered tools for academic success
Step: 2

Step: 3

Ace Your Homework with AI
Get the answers you need in no time with our AI-driven, step-by-step assistance
Get Started


